

Key takeaways from the Technical Performance and Crawl Budget analysis
Optimizing site speed and search engine visibility requires solving main thread congestion and server bottlenecks. Ignoring the real-world impact of heavy JavaScript and complex DOM structures directly hurts your bottom line:
- 1. Interaction metrics and main thread congestion Site speed evaluation now relies on field-measured interaction data. To maintain session viability and improve conversion rates, developers must use advanced scheduling APIs to segment long JavaScript tasks and prioritize immediate visual feedback.
- 2. The financial toll of technical debt and DOM complexity Overly complex document structures and forced synchronous layouts heavily penalize computational power, delaying browser painting. This unoptimized technical debt silently erodes profit margins by degrading user experience and inflating customer acquisition costs.
- 3. Crawl budget exhaustion via client-side rendering Search engine bots operate on strictly finite computational resources. Websites that rely heavily on client-side rendering rapidly exhaust their allocated processing time, resulting in delayed indexation. Stabilizing server response times is a mandatory prerequisite for search visibility.
For years, the industry operated under the assumption that a high laboratory score in generic page speed testing tools equated to functional search engine optimization. A webpage could theoretically achieve a flawless audit score, load its initial assets in milliseconds, and yet remain completely unresponsive to user inputs for seconds at a time. This dissonance between synthetic testing and actual usability prompted a structural revision in how search algorithms evaluate user experience. The deployment of specific performance thresholds removed the ambiguity from performance analysis, enforcing a strict separation between visual completeness and functional readiness.
Organizations expend significant capital attempting to optimize for static load times, ignoring the fact that Chrome usage data indicates ninety percent of a user's time on a page is spent after it has visually loaded. If the underlying JavaScript architecture blocks the browser's main thread during this period, the resulting interface lag destroys conversion probability. We pump thousands of dollars into generating empty top-of-funnel traffic from informational queries, and then wonder why the conversion rate is flatlining, is this the intended power of organic search? The economics of search visibility are harsh; an unresponsive site is an unprofitable site, regardless of its initial rendering speed.
Instrumentation and the Chrome user experience report
The most critical distinction in modern performance engineering is the separation between laboratory data and field data. Laboratory data is collected in a controlled environment with predefined device specifications and network throttling. It serves a purpose for consistent, repeatable debugging during the development cycle. However, laboratory data operates in a vacuum. It assumes a static user journey and cannot account for the volatility of real-world network conditions, varying processor speeds, or unpredictable user interaction overlap.
Conversely, field data is aggregated from actual user sessions through real user monitoring protocols. This telemetry, compiled in the Chrome User Experience Report, forms the basis of algorithmic evaluation. A site that performs adequately in a local Lighthouse audit may fail in the field when accessed via an underpowered mobile device attempting to parse bloated third-party scripts. Relying exclusively on laboratory data leads to misallocated engineering resources and persistent visibility issues in competitive search environments.
Effective diagnosis requires a toolchain that bridges the gap between field observations and laboratory reproduction. The process begins with evaluating the aggregated field data to identify URL clusters that fail to meet algorithmic thresholds. By accessing this data via PageSpeed Insights or Search Console, engineering teams can determine whether a specific page template requires remediation. If the field data indicates a problem, the analysis moves to the laboratory for granular profiling using Chrome DevTools.
Mechanics of interaction latency
The introduction of Interaction to Next Paint as the primary interactivity metric marked a necessary evolution from its predecessor. The previous metric, First Input Delay, only measured the latency before the browser began processing the first user interaction. It was fundamentally flawed because it ignored the time required to execute the event handler and the subsequent delay before the browser could paint the next frame. A site could register an excellent score while leaving the user staring at a frozen interface while a massive JavaScript bundle executed.
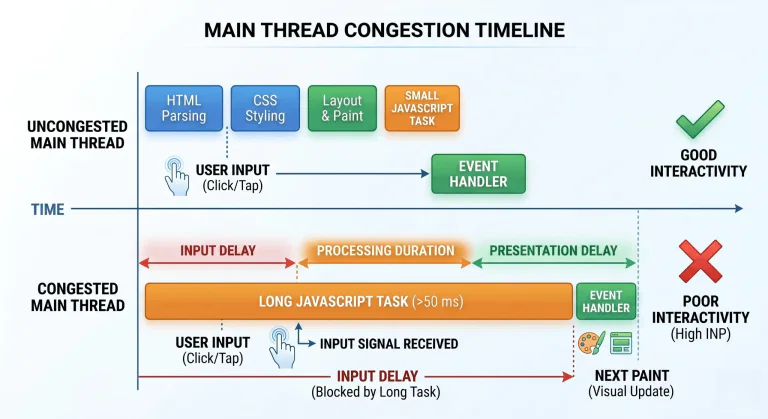
The updated metric corrects this oversight by measuring the complete duration of interactions throughout the entire page lifecycle. It records the latency from the initial user input, such as a tap, click, or keyboard press, until the browser presents the next visual frame. The algorithmic threshold for a passing experience requires this entire sequence to occur in two hundred milliseconds or less. Anything exceeding five hundred milliseconds indicates severe structural failure. When a page fails this threshold, it is almost exclusively due to the mismanagement of the browser's main thread.
Input delay and main thread congestion
The first phase of any interaction is the input delay. This is the period between the user's physical action and the moment the browser is capable of initiating the corresponding event handlers. While operating systems dictate a negligible baseline delay to register the hardware input, severe input delay is an engineered failure. The browser's main thread operates as a single-lane highway, responsible for parsing HTML, executing JavaScript, and updating layouts. If the user interacts with the page while the main thread is occupied by a long-running background task, the interaction is placed in a queue.

Input delay is frequently exacerbated by recurring JavaScript timers. Functions utilizing standard interval timers fire continuously, drastically increasing the probability that an execution cycle will collide with a user input. Furthermore, the overlap of interactions forces the browser to queue multiple heavy tasks simultaneously. For example, rapid keystrokes in an e-commerce search field might trigger expensive network requests for autocomplete logic with every character typed. If the architecture does not include mechanisms to debounce these inputs or abort obsolete network fetches using an AbortController signal, the main thread becomes heavily congested, and input delay scales linearly with user activity.
|
1 2 3 4 5 6 7 8 9 10 11 12 13 14 15 16 17 18 19 20 21 22 23 24 25 26 27 28 29 30 31 |
// Example: Optimizing a search field with AbortController let abortController; let searchTimeout; document.querySelector('#searchInput').addEventListener('input', (event) => { const query = event.target.value; // 1. Debouncing: Cancel the previous timeout if the user is still typing clearTimeout(searchTimeout); // 2. AbortController: Cancel the previous network request (if it is still pending) if (abortController) { abortController.abort(); } searchTimeout = setTimeout(async () => { abortController = new AbortController(); try { const response = await fetch(`/api/search?q=${query}`, { signal: abortController.signal }); const data = await response.json(); updateSearchResults(data); } catch (error) { if (error.name === 'AbortError') { console.log('The previous request was successfully aborted.'); } } }, 300); // 300ms delay }); |
Processing duration and script evaluation
Once the main thread becomes available, the browser begins executing the event callbacks associated with the interaction. This phase, known as the processing duration, is dependent on the efficiency of the application's JavaScript. In modern web applications, event handlers rarely perform isolated, simple state changes. They trigger cascades of application logic, data formatting, and state synchronizations. When processing duration exceeds fifty milliseconds, the execution is classified as a long task.
During a long task, the browser is entirely locked. It cannot render visual updates, process subsequent inputs, or handle scrolling. The browser adheres to a strict run-to-completion model; once a synchronous JavaScript function begins, the engine will not interrupt it to paint pixels to the screen. E-commerce platforms frequently suffer from processing duration failures when implementing complex filtering systems. A click on a category filter might invoke an expensive reducer function that recalculates the state for hundreds of product objects before yielding control back to the browser.
Script evaluation itself acts as a massive precursor to processing duration issues. During page load, the browser must compile script content into bytecode before execution. If a website bundles all its code into a single large script file, it results in a single massive evaluation task. Standard execution behavior in Chromium, Safari, and Firefox dictates that each script element kicks off a parsing and compiling task. While utilizing ES modules with specific type attributes can separate compilation into distinct tasks, the deferral of large bundles invariably shifts the evaluation penalty to the exact moment a user attempts their first interaction.
Presentation delay and the rendering pipeline
The final segment of the interaction measurement is the presentation delay. Even if the input delay is minimal and the JavaScript execution is optimized, the interaction is not complete until the browser calculates the visual changes and paints them to the screen. This requires the rendering engine to process style calculations, determine the layout geometry, and composite the final pixels.
Presentation delay is impacted heavily by forced synchronous layouts, commonly referred to as layout thrashing. The browser is designed to optimize rendering by batching visual changes and executing them at the end of the frame cycle. However, if a script modifies the geometric properties of an element and then immediately requests a layout value, the browser is forced to halt execution and instantly run the entire layout calculation to provide the accurate measurement. When this read-write cycle occurs within a loop, the browser is thrown into a state of continuous calculation, completely stalling visual updates.
Diagnostic APIs and real user monitoring
Before intervention can occur, the exact source of the bottleneck must be identified. Traditional performance monitoring tools struggle to provide granular attribution for field data. The standard approach requires deploying the web-vitals JavaScript library to collect telemetry directly from user sessions. By utilizing the attribution build of this library, engineering teams can extract precise timings for all three interaction phases, identifying the exact CSS selector of the element that triggered the delay. This surgical approach is necessary because aggregate data only indicates the existence of a problem; it does not identify the offending function in the codebase.
Leveraging the long animation frames API
The deployment of the Long Animation Frames API provides the necessary telemetry to dissect execution failures in real-time. This API surfaces detailed arrays containing duration metrics, blocking times, and specific render start timestamps for any frame that exceeds the acceptable threshold. More importantly, it includes script attribution data. Instead of merely reporting that a long task occurred, the API identifies the specific invoker, the source URL of the script, and the exact character position of the offending function.
This allows engineering teams to move directly from field data observation to codebase remediation. By capturing data via navigator.sendBeacon and piping it to a centralized logging system, teams can isolate the exact line of JavaScript causing main thread congestion across thousands of user sessions. When reproducing these interactions in the laboratory, engineers utilize the Performance panel in Chrome DevTools to record a trace. High values in Total Blocking Time observed during laboratory tests serve as strong proxy indicators that the application will fail interaction thresholds in the field. By aligning the interaction track with main thread activity, developers can hover over the execution blocks to isolate the exact event entries causing the delay.
|
1 2 3 4 5 6 7 8 9 10 11 12 13 14 15 16 17 18 19 20 21 |
// Collecting Long Animation Frames (LoAF) telemetry from real user sessions if (PerformanceObserver.supportedEntryTypes.includes('long-animation-frame')) { const observer = new PerformanceObserver((list) => { for (const entry of list.getEntries()) { if (entry.duration > 200) { // Threshold for noticeable interactive delays const telemetryData = { duration: entry.duration, renderStart: entry.renderStart, scripts: entry.scripts.map(script => ({ invoker: script.invoker, sourceURL: script.sourceURL, sourceCharPosition: script.sourceCharPosition })) }; // Dispatch the payload to a centralized analytics endpoint without blocking the thread navigator.sendBeacon('/analytics/loaf', JSON.stringify(telemetryData)); } } }); observer.observe({ type: 'long-animation-frame', buffered: true }); } |
Architectural remedies for interaction latency
The root cause of main thread congestion is monolithic execution. To maintain interactivity, engineers must manually intervene in the execution flow, breaking extensive computational work into smaller chunks. This requires a shift from writing code that simply executes correctly to writing code that executes cooperatively with the browser's rendering engine.
Manual deferral and scheduler yield logic
The most common historical approach to breaking up long tasks involves manually yielding to the main thread using standard timeout functions. By wrapping a portion of a long-running function in a timeout with a delay of zero milliseconds, the execution of that specific code is pushed into a new, separate task. This momentarily frees the main thread, allowing the browser to process any queued user inputs or render pending visual updates before resuming the computation.
While functional, this approach contains a critical architectural flaw. When code is deferred via a standard timeout, it is placed at the end of the browser's task queue. If the website is heavily burdened with third-party tracking scripts, analytics payloads, or ad network logic, those pending tasks execute before the deferred application code. This creates a scenario where yielding to the main thread inadvertently delays the completion of the user's interaction because the application loses priority to background noise. Furthermore, after five rounds of nested timeouts, the browser imposes a mandatory minimum delay, further slowing execution.
To resolve the prioritization failure inherent in standard timeouts, modern browser architectures introduced specialized scheduling APIs. The scheduler.yield() function is designed explicitly to manage cooperative multitasking. By utilizing this advanced yield function within an asynchronous task, developers pause execution, allow the browser to paint necessary visual feedback, and then immediately resume the remainder of the task without losing priority. The continuation of a yielded task via this API skips ahead of other pending background tasks, ensuring that the critical user interaction completes efficiently while still providing immediate visual rendering. Previous attempts to manage this using the isInputPending() API are no longer recommended, as that interface routinely fails to account for pending animations and yields false negatives during rapid interactions.
|
1 2 3 4 5 6 7 8 9 10 11 12 13 14 15 16 17 18 19 20 |
// LEGACY APPROACH (Prone to losing execution priority to background tasks): function yieldToMainLegacy() { return new Promise(resolve => setTimeout(resolve, 0)); } // MODERN APPROACH (Maintains task priority while preventing main thread lock-up): async function processLargeArray(items) { for (let i = 0; i < items.length; i++) { processItem(items[i]); // Yield to the Main Thread every 50 iterations, // allowing the browser to paint frames and respond to user interactions if (i % 50 === 0 && 'scheduler' in window && 'yield' in scheduler) { await scheduler.yield(); } else if (i % 50 === 0) { // Fallback mechanism for older browser engines await yieldToMainLegacy(); } } } |
Parallel execution via web workers
For applications that demand intense computational resources, such as real-time data formatting, complex state management, or cryptographic functions, yielding on the main thread is insufficient. The most effective strategy for preserving interactivity is the complete removal of non-interface logic from the browser's main thread. Web workers provide parallel execution environments, allowing heavy scripts to run in the background without impacting the user interface.
Implementing an off-main-thread architecture fundamentally changes the performance profile of an application. The main thread is reserved exclusively for processing user inputs and managing DOM updates, while the worker handles the computational load. Because workers lack direct access to the interface, engineers utilize libraries like Comlink to simplify cross-thread communication, abstracting message passing into standard promise-based function calls. Although the total execution time of a specific operation might be marginally longer due to the overhead of serializing data across threads, the interface never freezes. The user experiences a perfectly fluid application because the main thread is never blocked by the application's core logic.
Reducing the scope of style calculations
The efficiency of the browser's style calculation phase is directly proportional to the complexity of the application's CSS selectors. The rendering engine must match selectors to specific elements to determine the final computed styles. Browsers evaluate CSS selectors from right to left. A seemingly innocuous selector targeting a generic class nested deeply within multiple parent elements requires the browser to verify the entire ancestral chain for every matched element.
Optimizing this pipeline requires flattening the CSS architecture. Utilizing highly specific, single-class selectors removes the traversal burden from the rendering engine. When the browser only needs to match a single string to apply a style, the calculation phase completes in a fraction of the time, directly reducing presentation delay. The cost of style recalculation is generally the total number of invalidated elements multiplied by the complexity of the selectors; reducing either variable immediately accelerates frame rendering.
Managing structure and containment
Every node in the document object model represents a unit of memory and a potential layout calculation. A massive, deeply nested structure cripples interactivity. When a state change occurs, a large document forces the browser to evaluate thousands of elements to determine if their styling or geometric position has been affected. When JavaScript queries the structure, the memory cost of returning large node lists triggers garbage collection events, which further pause main thread execution.
Algorithmic guidelines suggest that a structure exceeding 1400 total nodes represents an excessive burden. Managing this requires architectural discipline. Deeply nested container elements must be flattened. For applications with extensive product grids or infinite scrolling feeds, modern CSS containment properties and content-visibility rules must be applied. These properties instruct the browser to skip rendering calculations for elements currently outside the user's viewport, effectively isolating the rendering cost to the visible components and preserving the responsiveness of the interface.
|
1 2 3 4 5 6 7 8 9 |
/* Optimizing long product grids or infinite scrolling feeds */ .product-card { /* Instructs the browser to skip rendering calculations for elements outside the viewport */ content-visibility: auto; /* Strict requirement: assigning placeholder geometric dimensions */ /* This prevents Cumulative Layout Shifts (CLS) when the element eventually renders */ contain-intrinsic-size: 300px 450px; } |
Commercial validation of interaction metrics
The pursuit of algorithmic performance thresholds is not an academic exercise; it is a fundamental driver of commercial viability. Analyzing enterprise case studies reveals a direct correlation between the reduction of interaction latency and the acceleration of revenue generation.
When QuintoAndar audited its real estate platform, it discovered that inefficient framework state updates were causing interaction delays of up to four seconds for a quarter of its users. By implementing prioritized yielding and optimizing their React transition hooks, the engineering team reduced interaction latency by eighty percent. This purely technical optimization resulted in a thirty-six percent year-over-year increase in conversion volume.
Similar results are evident in high-traffic media and booking systems. Disney+ Hotstar identified that a third-party spatial navigation library was causing severe layout thrashing on smart televisions. By replacing this dependency with composited animations and yielding execution during vertical scrolling, they reduced interaction delays by sixty-one percent, resulting in a one hundred percent increase in weekly engagement metrics. In the travel sector, redBus identified that a lazy-loading scroll event was causing severe main thread contention. By debouncing the listeners and reducing the data payload per network request, they lowered interaction latency to 350 milliseconds, driving a seven percent increase in total sales.
Even consent management platforms impact commercial metrics. PubTech optimized their script execution by implementing lazy de-rendering via the requestIdleCallback API and utilizing the scheduler to process high-priority consent logging. This reduced main thread congestion on client websites by sixty-four percent, which subsequently improved ad viewability by 1.5 percent because the browser could process advertising network requests without delay. These are not abstract vanity metrics; they are tangible demonstrations of how efficient JavaScript execution prevents the erosion of customer acquisition investments.
Visual stability and loading metrics
While interaction latency dictates the operational feel of a site, the initial perceived load and visual stability remain critical components of the algorithmic evaluation. The Largest Contentful Paint measures how long it takes for the primary visual element within the viewport to fully render, requiring a completion time of 2.5 seconds or less.
Server response time and resource delivery
A passing paint metric is impossible if the origin server is slow to respond. The Time to First Byte dictates the absolute baseline for performance; if the server requires a full second to execute database queries and generate the HTML document, the browser cannot begin downloading the critical image assets or parsing the render-blocking CSS necessary to display the page. Engineering teams must utilize robust caching policies and deploy assets via content delivery networks to minimize physical network latency.
Once the document arrives, the browser's parsing sequence must be optimized. Heavy JavaScript bundles placed synchronously in the head of the document halt HTML parsing entirely. Browsers cannot paint the primary visual elements if they are stalled downloading and evaluating analytics scripts. Critical resources, such as the primary hero image or the foundational web fonts, must be aggressively prioritized using preload directives.
Cumulative layout shift constraints
Visual stability is quantified by measuring unexpected layout shifts during the page lifecycle. An acceptable score requires a shift metric of 0.1 or less. Layout shifts occur when the browser paints an element, and a subsequent asset loads and forces the existing content to move. This is a common failure in media-heavy publishing sites and advertising networks.
Mitigating this requires strict geometric discipline in the source code. Every image, video, and third-party embed must possess explicit width and height attributes, allowing the browser to reserve the exact pixel space required before the asset finishes downloading. Furthermore, web fonts frequently cause layout shifts when the browser swaps the fallback system font for the downloaded custom font. Utilizing font-display swap directives alongside aggressive font preloading minimizes the duration and visual impact of this text rendering shift.
|
1 2 3 4 5 6 7 8 9 10 11 12 13 14 15 16 17 18 19 20 21 22 23 24 25 |
<!-- Preventing layout shifts (CLS) by enforcing explicit aspect ratios on images --> <img src="hero-banner.webp" alt="Summer promotional banner" width="1200" height="600" style="aspect-ratio: 1200 / 600;" fetchpriority="high" /> <!-- Preventing layout shifts during the web font swapping phase --> <link rel="preload" href="/fonts/main-font.woff2" as="font" type="font/woff2" crossorigin /> <style> @font-face { font-family: 'Main Font'; src: url('/fonts/main-font.woff2') format('woff2'); font-display: optional; /* Alternatively, use 'swap' if immediate text rendering is preferred over strict CLS compliance */ } </style> |
The economics of crawl capacity and demand
While interaction metrics govern the user experience and subsequent conversion rates, the underlying server architecture dictates whether the content is ever discovered by search algorithms. Search engines do not possess infinite computational resources. The vastness of the web requires algorithms to operate within strict resource constraints, assigning a specific allocation of time and processing power to evaluate any given domain. This allocation is the crawl budget, and mismanaging it guarantees that business assets remain invisible to the market.
Server logs and the crawl rate limit
The crawl budget is a dynamic calculation derived from two distinct variables: crawl capacity and crawl demand. Crawl capacity is a strict infrastructural ceiling. It represents the maximum number of simultaneous connections the search engine can establish without causing performance degradation on the host server.
Search bots actively monitor server response times. A server that responds to requests in 200 milliseconds permits the crawler to process five times more pages than a server that takes one full second to respond. If server logs indicate frequent connection timeouts or 5xx status codes, the algorithm assumes the infrastructure is failing. To prevent a self-inflicted denial of service attack on the host, the algorithm immediately throttles the Crawl Rate Limit.
We audit sites with millions of unique URLs, yet the server drops connections under moderate bot load—how exactly do we expect algorithms to index inventory they cannot physically access? Organizations frequently attempt to support complex, database-heavy applications on budget-tier hosting environments, lured by the vanity metrics of unlimited bandwidth marketing. A budget virtual private server costing fifteen dollars a month introduces hidden performance penalties, resulting in inconsistent time to first byte and frequent timeouts. The subsequent reduction in crawl capacity ensures that capital spent on content creation is wasted because the search engine refuses to process the site efficiently.

Indexing queues and rendering budget constraints
Crawl demand represents the algorithmic desire to evaluate the content. This is driven by URL popularity, internal linking structures, and the frequency of content updates. However, robust crawl demand is irrelevant if the crawl capacity is crippled by poor server performance.
The complication of modern search architecture is that crawling the raw HTML is only the first step. Because a vast majority of contemporary websites rely on JavaScript to inject content, the search engine cannot simply read the source code. It must pass the discovered URL into a queue for its rendering service. Here, the algorithm utilizes a headless browser to execute the application code, construct the layout, and capture the final state.
This process is exponentially more resource-intensive than standard HTML crawling. Consequently, search algorithms operate with a separate, highly constrained rendering budget. If an application relies on bloated client-side JavaScript, the execution task blocks the headless rendering process. When the rendering budget is exhausted, newly published content languishes in a queue for days or weeks, completely invisible to the market despite having been successfully crawled.
To circumvent this computational penalty, enterprise architectures must employ server-side rendering or sophisticated pre-rendering solutions. By executing the JavaScript on the origin server and delivering a fully populated, static HTML document to the search crawler, the computational burden is entirely removed from the search engine. The crawler instantly reads the content, bypasses the rendering queue, and immediately processes the URLs for indexation.
Margin erosion and technical debt recovery
The technical realities of main thread congestion and rendering constraints are rarely discussed during strategic marketing meetings. Instead, capital is allocated based on agency reports that prioritize superficial traffic metrics and automated laboratory scores. This systemic failure to audit actual architectural mechanics results in massive technical debt. This debt is a measurable financial liability that drains operational capital and destroys profitability.
Pricing models and infrastructure reality
When an architecture is burdened with parameter sprawl, duplicate templates, and heavy client-side rendering, the scope of maintaining organic visibility expands. Crawlers waste millions of requests parsing low-value filter permutations, while critical product pages fall out of the index. To compensate for the lack of organic visibility, organizations inevitably increase their paid acquisition budgets. This artificial inflation of customer acquisition costs represents direct margin erosion.
The pricing of technical search operations reflects this underlying reality. Proper infrastructural audits and the remediation of server log errors require highly specialized engineering resources. Agencies that operate on sustainable delivery margins understand that diagnosing these deep infrastructural failures requires extensive forensic analysis. A technical audit with five thousand dollars in basic delivery costs requires a fifteen thousand dollar project price to maintain standard agency margins and risk buffers. This is the literal financial penalty organizations pay for deploying flawed initial architecture.
Enterprise teams deploy advanced tooling like Botify, Lumar, or seoClarity to parse massive log files and identify where crawl budget is wasted. These platforms range from hundreds to thousands of dollars per month, representing another fixed cost incurred to manage unoptimized server behavior.
| Infrastructure tier | Cost / month | Typical TTFB | Architecture impact | Crawl capacity | Margin risk |
|---|---|---|---|---|---|
| Shared hosting Bluehost, HostGator, GoDaddy | $3–$15 Resources shared across hundreds of domains | 800ms–3s | No control over server processes. Neighbor account spikes block request handling. Incompatible with SSR or any meaningful rendering logic. | Very low. Frequent timeouts trigger permanent crawl rate throttling by the search engine. | Critical Forces full reliance on paid acquisition channels |
| Budget VPS DigitalOcean Basic, Linode, Vultr | $6–$24 Dedicated vCPU; no uptime SLA on base plans | 300ms–1s | Resource contention under traffic spikes. SSR is possible but unstable under bot load. Hidden costs for SSL, backups, and monitoring erode headline price. | Low–moderate. Better than shared, but crawl bursts from indexing can cause timeouts and reduce the allocated crawl budget. | High Organic visibility at risk; hidden operational overhead |
| Managed cloud VM AWS EC2, GCP Compute Engine, DigitalOcean Premium | $50–$200 Autoscaling available; predictable billing | 150–400ms | Stable, dedicated resources. Supports full SSR and hybrid rendering strategies without compromise. Server-side caching is practical and effective. | Good. Consistent TTFB allows the crawler to maintain a high crawl rate without triggering the bot's auto-throttle mechanism. | Neutral Correct baseline for most e-commerce and content sites |
| Edge / serverless CDN Vercel, Cloudflare Workers, Netlify, AWS CloudFront+Lambda@Edge | $0–$150 Pay-per-request; costs can spike with dynamic functions | <100ms | Pre-rendered HTML served from edge nodes closest to the user and crawler. Rendering budget cost drops to near zero for static and ISR pages. Cold starts affect dynamic routes. | Very high. Crawler receives fully populated HTML instantly, bypassing the rendering queue entirely. Ideal for SSG and ISR architectures. | Low Best organic contribution margin; watch dynamic function billing |
| Dedicated / bare-metal OVH, Hetzner AX, AWS Dedicated Instances | $500–$1,500 + managed security, monitoring, and ops overhead | <80ms | Full hardware control. Handles intensive SSR workloads, large-scale rendering pipelines, and high-concurrency crawl traffic without degradation. Requires in-house DevOps competency. | Maximum. Eliminates all server-side bottlenecks. Supports the highest possible crawl throughput, critical for sites with millions of indexed URLs. | Low Justified only for large-scale enterprise inventory (>500k URLs) |
Quantifying search contribution margins
The ultimate purpose of resolving technical debt is the restoration of healthy unit economics. In e-commerce applications, gross margin is calculated by subtracting the cost of goods sold from the revenue. However, the true metric of business health is the contribution margin, which subtracts the customer acquisition cost from the gross margin.
Organic search consistently delivers the highest contribution margins in digital commerce, routinely yielding between fifty and seventy percent because the per-click acquisition cost is effectively zero once the infrastructure is optimized. Conversely, paid social and non-branded paid search channels operate on razor-thin contribution margins, often falling below twenty percent due to competitive bidding.
If technical failures, such as severe input delay, layout thrashing, or exhausted rendering budgets, prevent a site from ranking organically, the organization must shift its acquisition volume to paid channels to maintain revenue. For every customer acquired via paid search instead of organic search, the contribution margin collapses. If an organization achieves a four-to-one return on ad spend with a forty percent gross margin, the actual contribution margin after ad costs is a mere sixty cents on a four-dollar purchase.
The resolution of technical search debt requires a cold, pragmatic assessment of the codebase and the server logs. By aligning the infrastructure with the strict mechanical requirements of modern search algorithms and browser rendering pipelines, organizations eliminate the inefficiencies that degrade user interaction metrics and restrict indexation. Success in this environment is not achieved through superficial content adjustments; it is engineered through the precise management of processor threads, rendering APIs, and server response constraints.


