

Key takeaways from the Digital Marketing Paradigm analysis
The traditional digital marketing playbook is fundamentally broken. Squeezed by soaring acquisition costs, blind attribution models, and aggressive consumer evasion, brands must urgently pivot their monetization strategies:
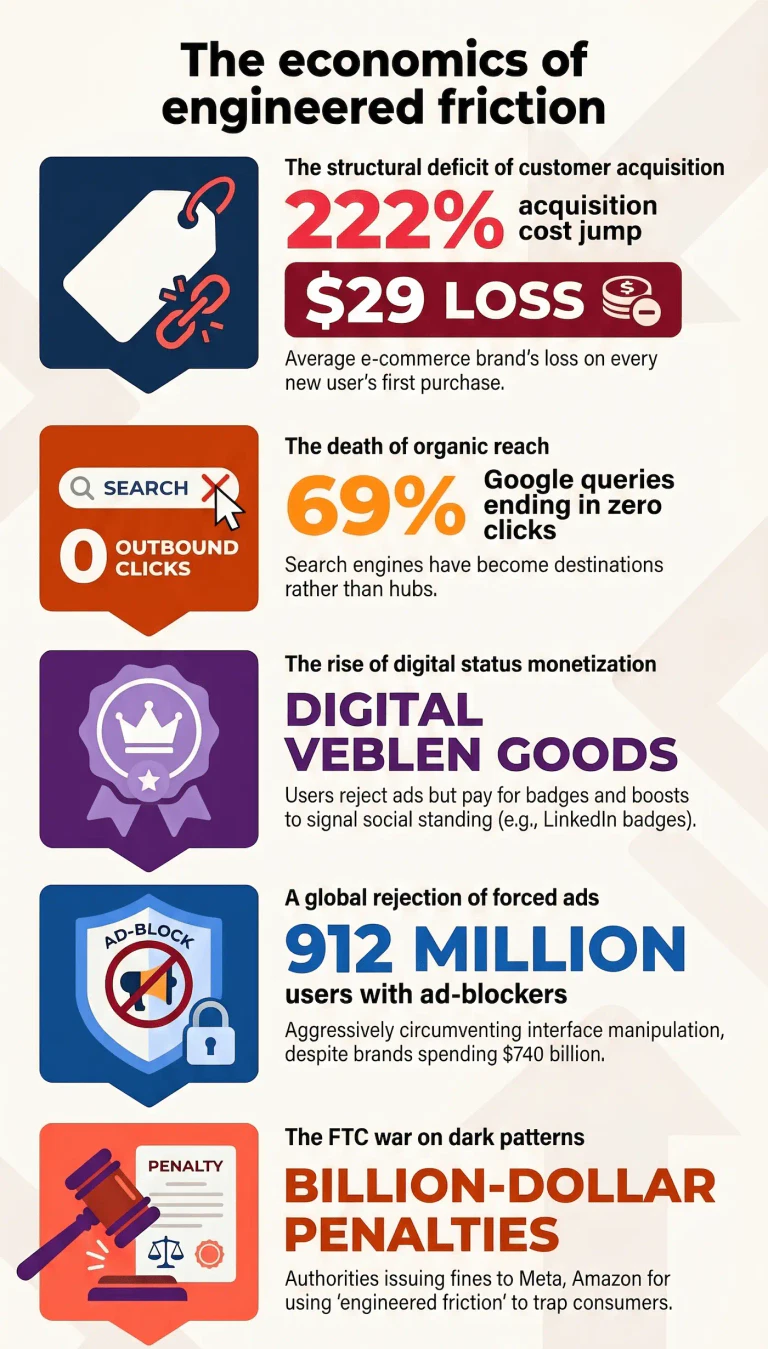
- 1. The structural deficit of customer acquisition Customer acquisition costs have skyrocketed by 222%, forcing average e-commerce brands to absorb a $29 loss per new user. This financial bleed is worsened by the absolute failure of single-touch attribution, as tracking degradation completely obscures complex, multi-touchdown purchasing journeys.
- 2. The death of organic reach and traditional ads Search engines have monopolized traffic, with up to 69% of queries ending in zero outbound clicks. Simultaneously, a staggering 912 million users actively utilize ad-blockers, proving that consumers will aggressively circumvent forced advertising and interface manipulation.
- 3. Regulatory crackdowns and digital status monetization As authorities like the FTC heavily penalize coercive UX and "dark patterns," platforms are finding success in alternative revenue streams. Selling "digital status symbols" leverages conspicuous consumption, proving users will pay premium subscriptions for digital distinction even as they block standard ads.
The digital advertising ecosystem operates on a foundational contradiction. Platforms report increasingly sophisticated behavioral targeting capabilities, yet the cost to acquire a single paying customer continues to rise. To bridge this gap, marketing departments allocate significant budgets to consumer neuroscience. The global neuromarketing market reached $1.79 billion in 2025 and is projected to expand at a compound annual growth rate of 6.8% through 2034. North America commands a 40% revenue share, driven by technology vendors offering semantic priming, eye-tracking, and implicit association tests.
The primary justification for this investment relies on a frequently cited statistic originating from Harvard Business School professor Gerald Zaltman, which posits that 95% of consumer purchasing decisions occur subconsciously. Vendors argue that traditional focus groups fail because consumers actively rationalize emotional decisions after the fact. Ad campaigns utilizing neural insights claim a 2.5 times greater return on investment and a 27% increase in brand recall compared to conventional methods. Consequently, 54% of Fortune 500 companies utilized neuro or biometric marketing performance tests by 2025.
The measurement instruments dictate the findings. Functional magnetic resonance imaging (fMRI) provides high spatial resolution by tracking blood oxygenation changes, yet it measures a functionally downstream metabolic response with a significant time delay. Electroencephalography (EEG) delivers high temporal resolution but lacks deep structural precision. Vendors deploy these tools to identify the exact millisecond a consumer decides to purchase, a process that can occur in a third of a second. Functional near-infrared spectroscopy (fNIRS), which measures cortical oxygenation using optical sensors attached to the scalp, is projected to grow at a 7.84% rate due to its less invasive physical footprint. The implicit association test segment dominates with a 39% market share, favored for its lower operational costs relative to fMRI hardware.
However, the commercial application of these neurological insights often ignores basic market mechanics. Academic neuroeconomics explores fundamental decision-making processes, but commercial neuromarketing frequently promises directly applicable insights for advertising measures that fail to scale. If 95% of purchasing decisions are subconscious, why do platforms report an 86% failure rate in deterministic tracking when users are presented with a simple privacy opt-in screen? The biology of the consumer remains constant, but the digital environment dictates the commercial outcome.
Cognitive biases and interface design constraints
When neuromarketing theory meets digital product design, it manifests through the deliberate exploitation of cognitive biases. User experience (UX) designers utilize these systematic errors in human thinking to optimize conversion rates. The application is clinical and highly standardized across e-commerce platforms.
The framing effect dictates how the context of data presentation influences user decisions. A price labeled as "discounted" attracts more buyers than the identical price presented without the label, shifting the user's perception from expenditure to savings. Optimism bias causes users to believe they have higher chances of success despite existing risks, a mechanism frequently leveraged in subscription trials where the user assumes they will remember to cancel before the billing cycle initiates.
The sunk cost fallacy proves particularly effective in multi-step checkout processes or complex onboarding sequences. Once a user invests significant time inputting data, they feel compelled to complete the transaction to avoid wasting the initial effort, regardless of friction introduced late in the flow. False consensus bias leads designers to assume their own behavior mirrors the target audience, a flaw that necessitates continuous A/B testing to correct.
These biases are often mapped onto the Fogg Behavior Model, which posits that behavior equals motivation, ability, and a prompt. UX design attempts to simplify the path to conversion by decreasing the required ability, meaning the user needs less motivation to complete the action. E-commerce platforms remove form fields, enable one-click purchasing, and utilize biometric authentication to eliminate physical friction. The objective is to trigger the subconscious decision-making process identified by neuromarketers before the conscious brain can engage in rational price comparison.
Reconciling marketing science with biometric data
The pursuit of deep, subconscious brand loyalty conflicts directly with established marketing science. The Ehrenberg-Bass Institute for Marketing Science, led by Byron Sharp, provides a structural counter-argument to the micro-targeting models sold by neuromarketing agencies. Analysis of consumer purchasing behavior across hundreds of categories demonstrates that brands grow almost exclusively by increasing market penetration among light buyers, not by engineering intense emotional connections with a niche audience.
Sharp's research refutes the traditional 80/20 Pareto principle in marketing. Empirical data reveals a 60/20 ratio, where the top 20% of buyers generate roughly 60% of sales, while the remaining 40% comes from consumers who purchase the brand only once or twice a year. For these light buyers, deep emotional tracking is less relevant than mental availability, defined as the simple probability that a brand is noticed or recalled in a specific buying situation.
Consumers do not psychoanalyze their purchases. They rely on distinctive brand assets acting as mental shortcuts to recognize a product in 0.2 seconds. Brands achieve growth through consistent reach and physical availability, regardless of whether a biometric sensor detects minor fluctuations in the amygdala during a focus group.
The limits of emotional differentiation
The Double Jeopardy law states that smaller-share brands are penalized twice: they possess fewer buyers, and those few buyers purchase slightly less often than the buyers of the leading brand. This implies that small brands with ultra-loyal, emotionally devoted customers almost never exist at scale; observed loyalty scales proportionally with market penetration.
To build market share, brands must connect their distinctive assets to multiple category entry points. These entry points represent the occasions, needs, motivations, and contexts that trigger a purchase. A brand with high awareness but low availability is recognized when named but fails to come to mind when the consumer actually needs the product category. Overly narrow targeting violates this law by artificially reducing useful reach in pursuit of a highly specific emotional demographic.
Advertising rarely convinces consumers through rational persuasion; rather, it acts as a weak nudge that stimulates memory to make brands more salient by repeating and building associations. This commercial reality renders many highly specific neuromarketing studies economically unviable. Spending significant capital to optimize an advertisement for a hyper-specific emotional response ignores the fact that 50% to 70% of fast-moving consumer goods volume comes from people who buy the product infrequently. They require simple recognition, not emotional resonance.
The customer acquisition cost crisis
While agencies sell the promise of optimized conversion, the economic reality of digital acquisition presents a structural crisis. Customer acquisition cost (CAC) increased by 222% over the past eight years, with a 60% rise occurring in the last five years alone. Data encompassing 14,800 companies across 22 sectors recorded a further 18.4% year-over-year CAC increase in 2025.
The financial consequence is stark. A decade ago, the average e-commerce brand generated a $19 profit on the first transaction with a new customer; in 2026, the average brand registers a $29 loss per new customer acquired. This erosion of capital is driven by increased platform competition, the degradation of targeting precision following privacy regulations, and the artificial inflation of auction costs. Meta consumes 68.31% of the average brand's ad budget while charging 20% more for the inventory year-over-year. Median CPMs (cost per thousand impressions) rose across all industries, with specific sectors like Health & Wellness experiencing 38% CPM inflation.
The disparity between top and bottom market performers highlights severe inefficiencies in capital allocation. Fourth-quartile SaaS companies currently spend $2.82 to acquire $1.00 of new annual recurring revenue, while top-quartile companies maintain near 1:1 efficiency. The median new CAC ratio increased by 14% in 2024, indicating that the typical SaaS company now spends two dollars in sales and marketing to acquire one dollar of new customer revenue.
Sector-specific acquisition benchmarks
Industry benchmarks reveal the extent of the acquisition expenditure. The following table illustrates the variance in average CAC across specific business sectors and channels in 2025/2026:
| Industry / Channel | Average CAC | Sales cycle dynamics |
| Paid Search (Google Ads) | $1,907 | High intent, immediate results, high cost |
| LinkedIn Ads | $982 | Precise targeting, lower intent, interruption-based |
| Fintech SaaS (SMB) | $1,450 | High-trust, rigorous qualification |
| Fintech SaaS (Enterprise) | $14,772 | Complex procurement, multiple stakeholders |
| Insurance | $1,280 | Relationship-driven, long sales cycles |
| Higher Education | $1,143 | Lengthy decision processes, high competition |
| Legal Services | $749 - $1,300 | Competitive market, early differentiation required |
| B2B SaaS (Average) | $536 - $702 | Varies widely by target market and niche |
| eCommerce SaaS | $274 - $299 | Short cycle, clear ROI demonstration |
| DTC / Premium eCommerce | $68 - $130 | Margin dependent, volume-based |
| Mass-market eCommerce | $45 - $87 | Transactional efficiency required |
.
A sustainable commercial operation requires a lifetime value to customer acquisition cost (LTV:CAC) ratio of at least 3:1. Ratios falling below 2:1 indicate a fundamental flaw in the business model, not merely an advertising optimization problem. Conversely, ratios above 5:1 suggest a company may be under-investing in growth.
Despite the mathematical reality that acquiring a new customer costs between five and twenty-five times more than retaining an existing one, many enterprises continue to allocate the vast majority of their marketing budgets to top-of-funnel acquisition channels. The probability of selling to a new prospect sits between 5% and 20%, compared to 60% to 70% for existing customers. Referral programs remain the most efficient acquisition channel, with 84% of B2B decision-makers starting their buying process through a referral, yet companies routinely underfund these mechanics in favor of programmatic display ads.
Attribution frameworks in a privacy-first web
The escalation of acquisition costs is compounded by a systemic failure in measurement. The traditional digital advertising model relied on deterministic tracking to connect a specific ad impression to a final purchase. This feedback loop fractured permanently.
The implementation of Apple's App Tracking Transparency (ATT) framework in 2021 altered the default setting for mobile identifiers (IDFA) from opt-out to opt-in. Global opt-in rates currently sit near 13.85%, effectively rendering 86% of iOS traffic invisible to granular tracking algorithms. This signal loss prevents ad platforms from accurately attributing conversions, resulting in misallocated budgets and broken retargeting pools. Ad platforms lose visibility into post-click behavior entirely for opted-out users; a marketer might spend $1,000 driving clicks to an application with zero insight into whether those users converted or generated revenue.
Furthermore, the ongoing deprecation of third-party cookies across major web browsers obscures cross-site user behavior. In this fragmented environment, 22% of organizations still rely exclusively on last-click attribution. This model assigns 100% of the conversion credit to the final interaction, creating a statistical illusion that ignores the cumulative effect of early-stage awareness.
B2B purchasing journeys routinely expose the inadequacy of the last-click model. Current data indicates the average B2B path to a closed deal spans 211 days, involves 76 tracked touchpoints, and requires consensus from 6.8 stakeholders across 3.7 different channels. Assigning the entirety of the revenue credit to the final search ad clicked on day 211 constitutes a fundamental misrepresentation of commercial reality.
The mathematics of multi-touch modeling
To adapt, 75% of companies transitioned to some form of multi-touch modeling. These frameworks attempt to distribute credit mathematically across the observed journey:
- Time decay attribution - assigns increasing weight to touchpoints that occur closer to the conversion event. Operating on a mathematical half-life, an interaction seven days prior to conversion receives half the credit of a same-day interaction. This model reflects recency bias but structurally undervalues initial discovery. If a B2B sales cycle spans 211 days, a seven-day half-life mathematically erases the value of the first 190 days of marketing expenditure.
- U-shaped attribution - allocates 40% of the credit to the first touch, 40% to the last touch, and distributes the remaining 20% evenly across intermediate interactions. This balances awareness and conversion but relies on arbitrary percentage splits.
- W-shaped attribution - adapts the U-shape for longer B2B cycles by assigning 30% each to the first touch, lead creation, and final touch, with the remaining 10% distributed elsewhere.
Data-driven attribution utilizes machine learning to assign credit based on actual customer paths, adapting to specific historical conversion patterns rather than fixed rules. However, this model requires significant data volume to function reliably. It demands over 600 monthly conversions in Google Ads and 400 within a 28-day window in GA4. Most mid-market B2B companies generating 50 to 200 leads per month cannot meet these thresholds, rendering algorithmic models useless for a vast segment of the economy.
Attribution decay limits the utility of all these models. As privacy regulations restrict data collection, the gaps between touchpoints widen. When measurement is organized around channels and campaigns rather than the user identity, the cross-device journey breaks. Marketers rely on media mix modeling (MMM) to estimate broader trends, but MMM requires massive datasets and fails to provide the daily optimization granularity required to adjust active campaign bids.
Search engines transition to destination platforms
The fundamental premise of search engine optimization—that high rankings yield proportional outbound traffic—is dissolving. Generative AI summaries and large language models (LLMs) transformed search engines from transit hubs into final destinations.
Data from late 2024 and 2025 confirms this structural shift. Approximately 80% of consumers now rely on AI-generated results for at least 40% of their search queries. Overall, 60% to 69% of global search queries end without the user clicking through to a third-party website. The device disparity is notable; on mobile interfaces, where screen real estate is heavily occupied by AI overviews, the zero-click rate reaches 77.2%.
When AI summaries are present on a search results page, the organic click-through rate (CTR) for traditional links drops by 47% to 58%. Position one rankings previously guaranteed traffic; now, they suffer a 58% CTR reduction when an AI overview occupies the top of the screen. Position two sees a 50.8% reduction, and position three drops by 46.4%. For publishers and informational sites, this results in an 18% to 44% year-over-year decline in traffic.
The impact on specific sectors proved severe. Software review platforms, despite being heavily cited by AI models as authoritative sources, experienced catastrophic visibility loss. Between early 2024 and late 2025, platforms like TrustRadius and Capterra recorded traffic declines of 92.2% and 89%, respectively. Prominent B2B software vendor HubSpot experienced a 70% to 80% drop in organic visits as users extracted the necessary information directly from the search interface.
The mechanics of hidden referrals
This phenomenon, defined as zero-click retention, serves the commercial interests of the platform operators by keeping users within their proprietary ecosystems for longer durations, thereby increasing their own ad inventory. Marketers are left competing for visibility within the AI citation itself. Even when a website is cited as a primary source within an AI summary, the click-through rate on that specific citation hovers at merely 1%.
When users do click through from generative AI platforms, the traffic often remains hidden. Between January 2025 and January 2026, generative AI platform visits grew 28.6%, yet 70.6% of the outbound traffic originating from these platforms arrives without referrer headers. In standard analytics software, this traffic is misclassified as "direct".
This dark AI traffic converts at a rate of 10.21%, compared to 2.46% for standard direct traffic. AI traffic overall delivers a sign-up conversion rate of 1.66% versus 0.15% for traditional organic search, an 11x premium. Consequently, marketers systematically undercount the return on investment from AI citations while over-indexing on trackable, lower-quality search clicks. The commercial implication is clear: visibility is no longer synonymous with acquisition. Brands must optimize for AI crawlability to ensure inclusion in the training data, accepting that their intellectual property will be summarized and delivered to the user without generating a corresponding site visit.
The ad-blocking economy and platform retaliation
Global digital advertising spend is projected to reach $740 billion in 2026, capturing 73% of total media budgets. Agencies and platforms celebrate these volume metrics, yet they simultaneously ignore the expanding infrastructure built by consumers to evade this exact expenditure. Agencies celebrate billions in automated ad spend while the average user installs three ad-blockers, are we optimizing for the same reality?
More than 52% of consumers across 48 global markets installed or utilized an ad-blocker. Active, regular usage sits at 31.5% of internet users worldwide, translating to approximately 912 million individuals actively filtering advertising from their daily digital consumption. Penetration rates vary geographically, with Indonesia at 40%, China at 37.6%, Poland at 34.3%, and the United States at 32.2%. The global ad blocker user base increased over 21x since 2012.
The demographic data highlights a generational rejection of the standard advertising model. Usage is highest among males aged 25 to 34 (36.2%), and 66% of Gen Z actively employs ad-blocking technology. This specific cohort exhibits an average active attention span of just 1.3 seconds when exposed to online advertisements. In specialized digital environments, the resistance is even more pronounced; 64% of livestreaming viewers utilize ad-blocking tools.
Consumers list excessive ad volume (63.2%), intrusive formats (53.4%), and privacy concerns (40.3%) as the primary motivations for installation. Ad blocking is estimated to cost publishers around $54 billion in lost advertising revenue worldwide.
In response to this revenue threat, major platforms escalated enforcement measures. Throughout 2024 and 2025, YouTube implemented strict protocols to detect and restrict access for users running ad-blockers. The behavioral outcome contradicted the platform's intent. Traffic to ad-blocker download pages spiked 336% following the enforcement actions. Only 11% of users reported a willingness to disable their blockers, while 22% stated they became more motivated to find superior circumvention software. Media planning models that equate paid reach with actual human exposure operate on a fundamentally flawed premise, systematically overestimating effective frequency and campaign impact.
Interface manipulation and regulatory enforcement
Faced with rising acquisition costs, attribution failure, and active consumer evasion, platforms and retailers increasingly rely on engineered friction to maintain revenue. The deployment of dark patterns triggered significant regulatory blowback globally.
In September 2025, the United States Federal Trade Commission (FTC) finalized a historic $2.5 billion settlement with Amazon and two senior executives regarding deceptive enrollment and cancellation practices for its Prime subscription service. The penalty consisted of a $1 billion civil fine and $1.5 billion mandated for consumer refunds, representing the second-largest restitution award in FTC history.
The FTC complaint detailed a systematic deployment of coercive design. During checkout, Amazon presented prominent buttons that implicitly enrolled users in a $14.99 monthly recurring subscription, while obscuring the option to decline behind small, ambiguous links. One specific tactic involved a button labeled "No, I don't want Free Shipping" to deter users from avoiding the subscription.
The cancellation process was equally engineered to prevent revenue churn. Internally code-named the "Iliad Flow" by Amazon engineers, a deliberate reference to the lengthy, arduous Trojan War, the offboarding sequence required consumers to navigate a four-page, six-click, fifteen-option labyrinth filled with diversions and discount offers. Executive communications revealed intentional decisions to reject interface simplification because easier exits directly damaged the bottom line.
These practices violated Section 4 of the Restore Online Shoppers' Confidence Act (ROSCA) and Section 5 of the FTC Act. The settlement established personal liability for executives who knowingly implement dark patterns, fundamentally altering the risk calculus for product managers. The regulatory environment tightened further in October 2024 with the finalization of the FTC's "Click-to-Cancel" rule, mandating that ending a subscription must be as structurally simple as initiating it. Similar enforcement occurred in the gaming sector, with Epic Games paying a $245 million FTC settlement due to Fortnite interfaces that facilitated accidental, single-click purchases by minors.
Algorithmic oversight and compliance realities
European authorities deploy automation to match platform scale. In Poland, the Office of Competition and Consumer Protection (UOKiK) launched a project in 2026 utilizing artificial intelligence to detect dark patterns across e-commerce sites. UOKiK trained its models on the source code of hundreds of platforms to identify practices such as artificial countdown timers, the automatic addition of products to baskets, and misleading sorting algorithms.
In one investigated case, a prominent platform's "from the cheapest" sorting option systematically hid mandatory service fees until the final click, artificially inflating the perceived ranking of specific products. Under Polish and EU law, such manipulation of collective consumer interests carries potential fines of up to 10% of a company's annual turnover. UOKiK also aggressively pursues resale price maintenance; in the Oltens case, the authority penalized a bathroom equipment manufacturer for maintaining a dual pricing system that punished retailers who sold below mandatory minimum prices online.
However, the efficacy of these fines remains questionable. Between 2021 and 2025, UOKiK imposed penalties exceeding PLN 3.6 billion (approximately EUR 840 million). Yet, the actual collection rate highlights a lengthy appellate process. The following table details the discrepancy between fines levied and fines collected:
| Year | Amount imposed (PLN million) | Amount paid (PLN million) |
| 2021 | 486.1 | 155.2 |
| 2022 | 428.4 | 117.9 |
| 2023 | 612.3 | 192.9 |
| 2024 | 937.6 | 136.4 |
| 2025 | 1,154.0 | 307.0 |
.
When the financial upside of interface manipulation outpaces the immediate cost of regulatory enforcement, dark patterns remain a rational business strategy. A company appeals the decision to the specialized court (SOKiK), delaying payment for years while continuing to harvest revenue from the contested interface design.
The monetization of digital status and scarcity
While dark patterns coerce users into retaining subscriptions, a parallel economic model thrives on voluntary, high-margin continuity. Tech platforms successfully digitized the concept of Veblen goods, luxury items for which demand increases as the price rises, serving primarily as tools for conspicuous consumption and social distinction. In the physical world, this applies to luxury vehicles and haute couture; in the digital ecosystem, it manifests as platform badges, premium profile colors, and animated avatars.
Discord, a communication platform initially built for gamers but now capturing a 33% share of the group messaging market, demonstrates the scale of this model. Serving an estimated 259 million monthly active users in 2026, the company generates the majority of its projected $380 million to $561 million annual revenue through Discord Nitro, a voluntary subscription service. Nitro offers minimal functional utility, but delivers significant social utility through custom emojis, unique profile badges, and the ability to "boost" servers. Boosting visibly displays the user's financial contribution to the community, establishing immediate social hierarchy.
Users spend an average of $47 annually on these subscriptions and boosts, effectively paying for digital status markers within their specific micro-communities. In early 2026, Discord launched a $199.99/year Business tier, securing 400,000 subscribers in 60 days by offering priority moderation and advanced analytics.
Similarly, LinkedIn leverages professional anxiety and status-seeking to drive its Premium subscription tier, which generated over $2 billion in revenue in the past year. Beyond the functional benefits of InMail credits and advanced search filters, the subscription provides a gold LinkedIn badge displayed prominently next to the user's name in search results and on their profile. This badge operates as a classic digital Veblen good, signaling professional seriousness and financial capacity to recruiters and peers.
The labor of conspicuous consumption
The behavioral science underpinning this monetization relies on "pecuniary emulation". Individuals imitate the consumption patterns of higher social strata to elevate their own perceived standing. On highly visual platforms like Instagram, this emulation drives the creator economy. Users engage in meticulously curated "leisure labor", the rigorous, uncompensated work of editing and presenting an effortless, luxurious digital identity.
The digital ecosystem accelerates this dynamic through instantaneous social validation metrics. Likes, shares, and comments function as digital status capital, converting passive consumption into an active, measurable performance of social hierarchy. Platforms do not need to rely on the dark patterns of the Iliad Flow when they can convince users to willingly subscribe to status algorithms that publicly validate their digital existence. A viral unboxing of a rare digital collectible functions identically to parking an expensive car in a visible driveway, but scales infinitely without manufacturing costs.
The labor economics of digital friction
The architecture supporting both coercive subscription flows and digital status symbols requires a specific labor force. Analyzing the UX/UI professional market provides context on the resources deployed to optimize these environments.
According to a 2024 industry report analyzing the IT and UX/UI sector in Poland, the workforce responsible for designing digital interfaces shifted toward senior talent. Mid-level (Regular) professionals constitute 56.4% of the UX/UI workforce, while Seniors represent 25.5%. The market contracted for entry-level positions, with Juniors making up only 7.4% and Interns 1.1% of the sector. Corporations consolidate design responsibilities among experienced practitioners capable of executing complex behavioral mapping and multi-touch journey orchestration.
Compensation models illustrate the commercial value placed on interface optimization. The median net salary for a Senior UX/UI designer operating on a B2B contract reaches 17,941 PLN, while Tech Leads and Directors command median salaries of 26,000 PLN and 24,000 PLN, respectively. The vast majority of these professionals (87.8%) work exclusively for a single employer, indicating that proprietary design systems and internal platform optimization require dedicated, full-time focus rather than freelance consultation.
The commercial mandate for these design teams is uncompromising. Whether working for a B2B SaaS platform attempting to lower a $702 acquisition cost, or an e-commerce retailer combating a 60% zero-click search environment, the objective remains identical. The designer must engineer an interface that minimizes the friction of purchase while maximizing the friction of departure. As tracking signals fade and ad blockers proliferate across the user base, the interface itself becomes the final mechanism of commercial control. Data privacy laws restrict how platforms follow users across the internet, forcing companies to extract maximum value from the exact moments the user occupies their proprietary digital real estate. The resulting architecture prioritizes psychological leverage over functional utility, demanding users navigate an ecosystem built entirely on the economics of friction.


