
Executive benchmarks
- Overall marketing averaged 9.4% of company revenues in the latest CMO Survey, while other trackers report flatlining around 7.7% depending on panel and methodology.
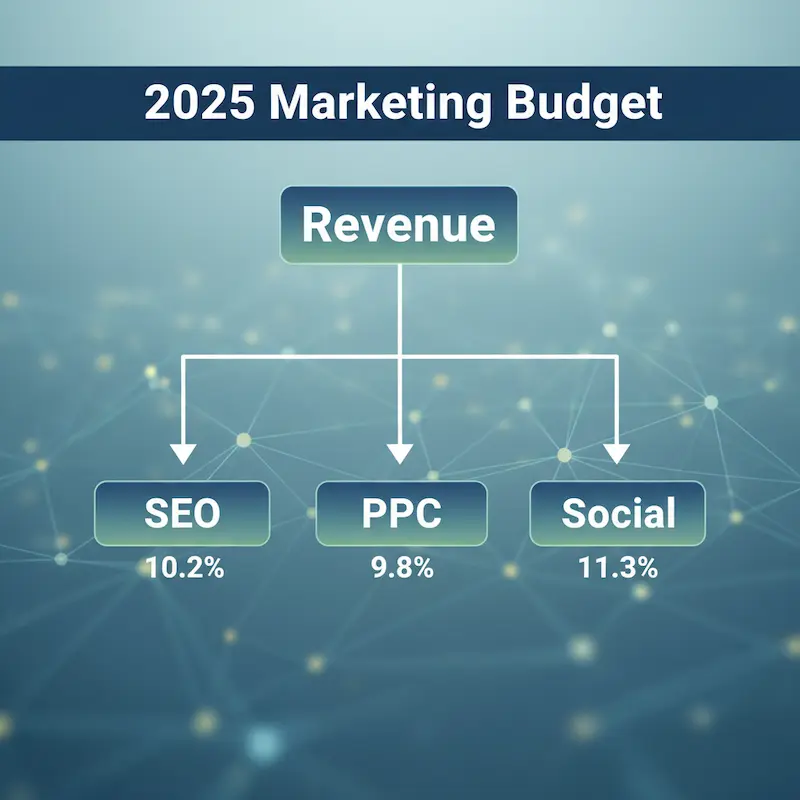
- Within the marketing budget, recent analyses of the CMO Survey place social media near 11.3% of spend, content/SEO near 10.2%, and paid search around 9.8% as a practical starting split that teams should tune by measured payback.
- CMOs continue to push more channel budget to digital and to paid media specifically, which increases scrutiny on incrementality, CAC payback, and reallocation discipline mid-year.
Industry baselines (% of revenue)
Use these sector averages to set the total annual marketing envelope, then apply channel shares to derive revenue-level targets for SEO, PPC, and social.
Channel shares (inside marketing)
Treat these as initial weights and re-balance quarterly toward segments with the strongest incremental ROAS and acceptable payback windows.
- SEO (content/organic) ≈10.2% of marketing budget; note that the CMO Survey reports content explicitly, which functions as the core driver for SEO and can be used as a proxy when technical SEO is budgeted within the same workstream.
- PPC (paid search) ≈9.8% of marketing budget; rising CPCs make value‑based bidding, negatives, and landing intent-match essential to preserve margins.
- Social media ≈11.3% of marketing budget today (with long‑run growth expectations), acknowledging that realized spend has historically lagged projections.
Revenue targets by industry (computed)
Multiply industry % of revenue (above) by channel share of the marketing budget (this section) to get revenue‑level targets.
Method and guardrails
- Formula: Channel % of revenue = Industry marketing % of revenue × Channel % of marketing budget, using CMO Survey for totals and social, and CMO‑derived syntheses for content/SEO and paid search.
- Governance: Keep LTV/CAC ≥ 3:1 and payback ≤ 12 months for scalable segments; if either slips, fix conversion and targeting before adding budget.
When to tilt budgets
- Tilt toward PPC when targets are time‑bound and intent pools are proven; use value‑based bidding, robust negatives, and aligned landing experiences to manage CPC pressure and protect unit economics.
- Tilt toward SEO when CPCs inflate, margins tighten, or keyword white‑space is evident; compound growth via technical health, intent‑matched content, and authority building that adheres to people‑first guidance.
- Tilt toward social when brand lift, creator leverage, and full‑funnel remarketing improve assisted conversions and reduce blended CAC across channels.
On‑page structure that ranks
- Follow Google’s people‑first content playbook: demonstrate first‑hand experience, original insights, and clear problem‑solving with transparent authorship and editorial accountability to satisfy E‑E‑A‑T expectations.
- Use snippet‑friendly formatting: definition boxes, scannable bullets, and 40–60‑word direct answers under precise H2/H3s to compete for featured snippets and AI‑assisted surfaces.
Schema and technical signals
- Implement Article (and FAQ where appropriate), Author, and Organization schema to clarify entities and improve eligibility for rich results as Google continues to simplify result modules while relying on structured data to understand content.
- Adhere to Search Essentials and ranking systems guidance; ensure clean metadata, logical headings, and crawlability so systems can interpret content purpose and context without ambiguity.
Practical budgeting steps
- Set the 12‑month envelope at the sector baseline (e.g., 9.31% for healthcare) and split by the starting shares above, then reallocate 10–20% quarterly toward initiatives with superior incremental ROAS and acceptable payback windows.
- Use a 70‑20‑10 framework across proven/growth/experimental tactics inside each channel to maintain learning velocity without starving core performance drivers.
Example - healthcare ($10M revenue)
- Total marketing ≈ $931k using 9.31% baseline from sector data; initial splits yield ≈ $95k for SEO (content/organic), ≈ $91k for PPC (paid search), and ≈ $105k for social, with quarterly rebalancing based on CAC payback and incremental lift.
- Track MER, ROAS, CAC, payback, and contribution margin per campaign, and document reallocation decisions to satisfy increased CFO scrutiny on value proof points in 2025.
Why this approach wins in 2025
- It is benchmark‑anchored (CMO Survey, Gartner) yet ROI‑driven, which aligns with stagnant budgets and rising demands for measurable outcomes.
- It integrates Google’s people‑first and technical guidance to maximize extractability, snippet eligibility, and trust, which are critical to competing in simplified SERPs and AI‑assisted search experiences.


