

Key takeaways from the Digital Advertising & Retail Media analysis
The digital advertising ecosystem is becoming increasingly opaque and expensive. Brands must navigate a landscape where platforms grade their own homework, acquisition costs soar, and AI tools often backfire:
- 1. Metric illusion and the loss of tracking truth Following iOS 19 and the deprecation of deterministic tracking, up to 70% of conversions are now modeled by the platforms themselves. This creates a dangerous gap between reported marketing efficiency and actual commercial revenue, leading brands to confuse mere visibility with genuine demand.
- 2. Margin taxes and heavily subsidized competition Retail media networks now act as a mandatory, high-margin tax for baseline digital shelf visibility. Simultaneously, customer acquisition costs are structurally inflated by subsidized foreign marketplaces like Temu, which absorb massive losses to outbid and price out standard direct-to-consumer operators.
- 3. The algorithmic backfire of AI creatives While AI can generate endless ad variations, deploying them simultaneously fragments algorithmic signals. This prevents advertising systems from gathering sufficient data weight, keeping campaigns stuck in learning phases and rapidly accelerating user fatigue.
Digital marketing in 2026 operates under a persistent contradiction. If a chief marketing officer looks exclusively at platform dashboards, business has rarely been better. Automated campaigns claim efficient conversions, email service providers report returns exceeding thirty to one, and social platforms celebrate billions of impressions. If that same executive looks at the profit and loss statement, customer acquisition costs are climbing, margins are compressing, and overall top-line revenue is frequently flat.
This disconnect is not the result of a single platform error. It is the output of an industry that has systematically misaligned its measurement incentives. Ad platforms are incentivized to claim credit for as many conversions as possible, regardless of whether their ad caused the sale or simply happened to be served to a user who was already going to buy. Agencies are incentivized to report high returns on ad spend to justify their retainers. Brand teams are incentivized to highlight top-of-funnel engagement metrics to demonstrate cultural relevance.
The financial data suggests otherwise. As operating overhead rises and pricing power weakens across multiple sectors, the tolerance for marketing metrics that cannot be reconciled with bank deposits is disappearing. The industry has reached a point where the volume of data available to marketers has an inverse relationship with the clarity of their commercial performance. Advertisers are presented with a wealth of engagement signals, yet the actual mechanisms driving incremental revenue remain obscured by black-box algorithms and proprietary attribution models designed to flatter the network selling the media.
Attribution decay and the rise of modeled conversions
Over the past two years, the fundamental mechanics of digital attribution have deteriorated. This decay is the direct result of privacy interventions by hardware manufacturers, browser restrictions, and shifting regulatory frameworks. The consequences for performance marketing are severe, primarily because the industry spent the previous decade optimizing against deterministic, user-level tracking.
In April 2021, Apple introduced App Tracking Transparency, severely limiting cross-app data sharing. By the second quarter of 2026, the opt-in rate for this tracking had dropped to 11%. Apple further degraded visibility with iOS 18 and iOS 19 by expanding Link Tracking Protection. This feature strips identifiers, such as the fbclid parameter used by Meta, from URLs when users navigate across apps or use private browsing. When these parameters are removed, the ad platform loses the direct mechanical link between a user clicking an ad and that same user completing a purchase on a merchant website.
The deprecation of tracking windows and algorithmic blindness
The advertising platforms did not accept this loss of visibility passively. They adapted by changing the rules of measurement. On January 12, 2026, Meta deprecated two critical attribution windows: the 7-day view and the 28-day view. Overnight, many advertisers saw their reported conversions drop by 15% to 30%. The performance of the ads had not changed. The definition of a measurable success had changed.
If a performance marketer relies exclusively on the Meta Pixel in 2026, they are capturing only 40% to 60% of their actual conversions. The remaining data is lost to iOS privacy restrictions, browser limitations, ad blockers, and consent banners. This creates a severe operational problem. Because the platform algorithm optimizes based on the data it receives, an account experiencing massive signal loss will train its machine learning models on a fraction of its actual customer base, leading to inefficient bidding and deteriorating traffic quality.
How platforms mask signal loss through statistical estimation
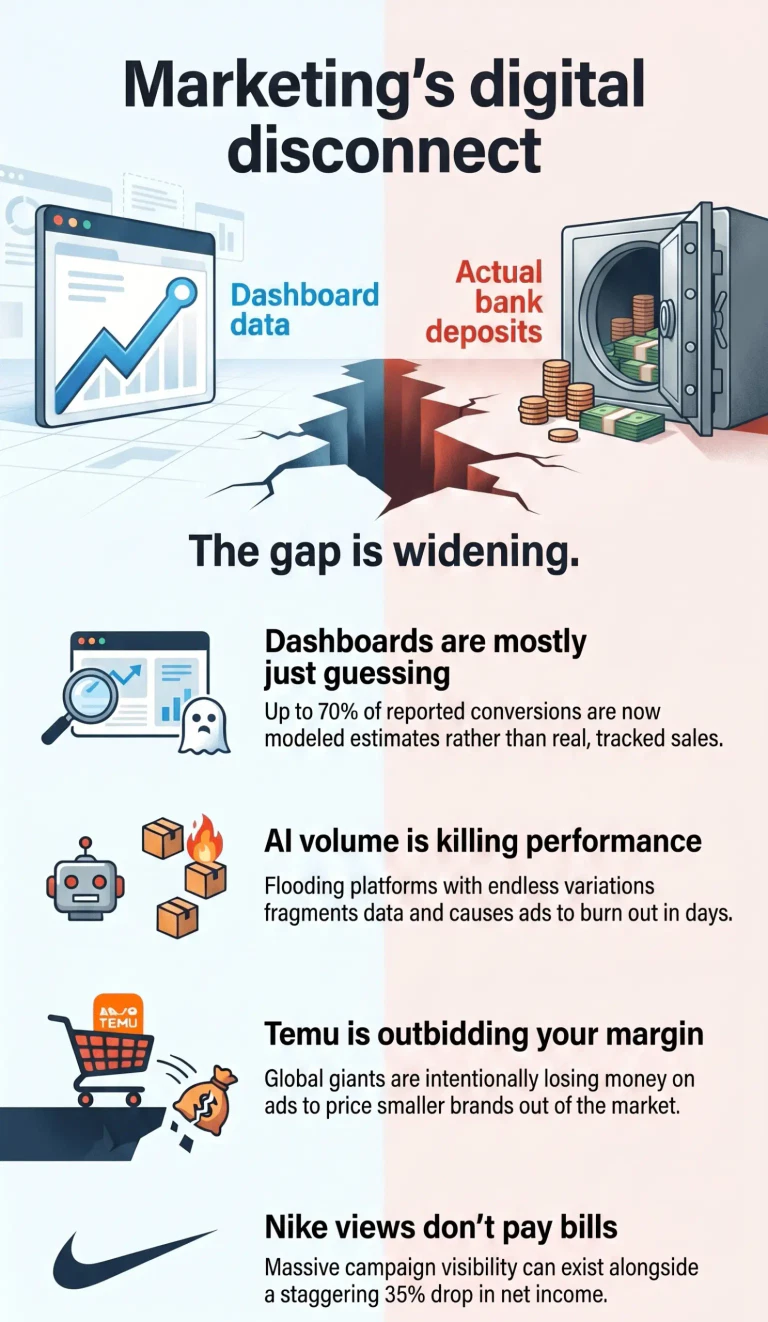
To compensate for the data they can no longer observe directly, Google and Meta aggressively shifted toward modeled conversions. Up to 70% of conversions reported in certain Google Ads campaigns are now estimates generated by machine learning models rather than directly observed deterministic events. When a platform loses the signal, it looks at historical behavior, contextual indicators, and aggregated trends to guess how many conversions likely occurred.
This transition from observation to estimation creates a significant conflict of interest. The platform selling the inventory is now the same entity estimating how well that inventory performed. Modeled conversions allow platforms to smooth out reporting dips and claim credit for cross-device behavior. They do not, however, answer the fundamental commercial question: did this specific ad spend generate revenue that would not have existed otherwise?
If the platform selling the inventory is the same entity estimating its effectiveness, whose commercial interests are actually being served?
The necessity of first-party data plumbing
Agencies and operators who continue to rely solely on browser pixels are operating at a severe disadvantage. The standard operational response in 2026 is the mandatory implementation of server-side tracking, such as Meta’s Conversions API (CAPI).
Server-side tracking allows the merchant’s server to send purchase data directly to the ad platform’s server, bypassing the browser entirely. However, this is merely a data recovery tactic. It improves the Event Match Quality (EMQ) sent to the bidding algorithm, but it does not solve the fundamental attribution problem. To understand true performance, sophisticated operators are moving away from platform-reported multi-touch attribution entirely, favoring incrementality testing, geo-holdout experiments, and marketing mix modeling. These methods ignore the click path and instead measure the causal relationship between spending money in a specific region and observing a corresponding lift in total sales.
| Ad platform metric | What the metric suggests | What remains commercially unknown |
| Modeled conversions | The algorithm's estimate of total commercial impact | How much of that impact is statistically verified |
| Last-click return | Revenue from users who clicked the ad immediately before purchase | Users who intended to buy anyway through brand search |
| View-through attribution | Users who saw an ad, did not click, but later bought | Causality, as the ad may not have influenced the purchase |
Creative fatigue in the era of automated variance
As targeting controls have been abstracted away by automated campaign types like Google Performance Max and Meta’s Advantage+ Shopping Campaigns, the primary lever remaining for media buyers is creative execution. The industry assumption is that higher creative volume allows algorithms to find better audiences. Artificial intelligence tools have made it possible to generate hundreds of ad variations in a matter of minutes.
This theoretically infinite creative pipeline has introduced a severe operational failure: algorithmic data fragmentation.
Advertising systems rely on statistical significance. They require a concentration of conversion data to identify patterns and optimize delivery. When an advertiser launches 150 slightly altered AI-generated images into a single campaign, the platform distributes the budget across all of them. Each individual variation receives limited delivery. No single ad accumulates enough data to confidently exit the learning phase. The algorithm is forced to continually restart its assumptions, resulting in volatile costs, extended learning phases, and inefficient spend.
Why synthetic diversity fragments conversion data
Furthermore, generating high volumes of similar creative leads to synthetic diversity. The ads may possess different hexadecimal color codes or altered headline phrasing, but to the consumer, they represent the same fundamental visual pattern. Human attention naturally filters out repetitive structures. Research demonstrates that users quickly learn to ignore anything that looks like a standard advertisement, a behavioral mechanism known as banner blindness.
When AI models are used to generate creative at scale, they tend to average out design choices, producing highly polished but deeply generic imagery. The market becomes flooded with visually indistinguishable content. Consequently, creative fatigue accelerates.
Historically, a strong core advertisement could run efficiently for months. In 2026, campaigns spending upwards of $5,000 per day frequently burn out their creative assets within three to five days. Meta's Andromeda algorithm updates process ad variants 10,000 times faster, evaluating creative signals to determine targeting. If a user does not engage, the algorithm registers a drop in relevance, downranks the delivery, and increases the cost per thousand impressions. Marketers respond by injecting another batch of AI-generated variants, perpetuating the cycle of fragmentation and rapid fatigue without ever addressing the core issue of messaging resonance.
Byron Sharp’s concept of distinctive brand assets provides clarity here. An ad requires consistent, recognizable elements to build mental availability. When a brand constantly rotates generic AI imagery, it destroys its own distinctive assets, making the brand harder to recognize and easier to scroll past.
Subsidized acquisition and the Temu margin tax
While measurement has become more opaque, the actual cost of buying traffic has become demonstrably more expensive. The baseline cost of digital real estate is rising, largely driven by macroeconomic factors and the aggressive market entry of heavily capitalized foreign competitors.
In the first quarter of 2026, standard Google Shopping cost-per-click rates surged by 23% in key regions. Meta’s average cost per thousand impressions climbed 20% year-over-year, reaching $13.48, with verticals like sports and apparel seeing even steeper increases. This is a structural cost increase. There is a finite amount of premium digital inventory, and the demand for that inventory has intensified.
The primary catalyst for this bid density is the sustained advertising expenditure of Chinese marketplaces. Entities like Temu, Shein, and JD.com’s Joybuy are purchasing European and North American search engine results pages and social feeds at volumes that distort traditional auction mechanics. In 2023 alone, Temu and Shein spent an estimated $2.7 billion on digital advertising, with Temu reportedly channeling $1.2 billion directly into Meta.
Unit economics and the destruction of standard margins
These marketplaces operate on financial models that break standard direct-to-consumer unit economics. A healthy e-commerce brand typically targets a 3:1 ratio of lifetime value to CAC. This ensures the brand generates enough gross margin over the life of the customer to cover the initial marketing expense, the product cost, and operational overhead. Below a 1:1 ratio, a business is actively losing money on every acquired customer.
Temu currently operates with an estimated 1.5x LTV to CAC ratio. They are explicitly buying growth at a loss, burning cash to acquire market share. This strategy is compounded by their customer retention metrics; reportedly, their repeat purchase rates sit between 20% and 30% after 90 days. Because their average order value is exceptionally low, and their retention behavior is unpredictable, they must continuously fund top-of-funnel acquisition to sustain volume.
For a standard retail brand, trying to outbid a competitor willing to lose money on every transaction is commercial suicide. When an independent retailer competing in the apparel or electronics sector sees their Google Shopping bids fail, they are often losing auctions to entities that are completely unconstrained by immediate profitability mandates. The result is universal margin compression for any advertiser reliant on paid distribution.
| Metric comparison | Healthy DTC brand | Hyper-growth marketplace (Temu) | Commercial implication |
| LTV to CAC ratio | 3:1 or higher | 1.5x | Marketplaces subsidize acquisition costs at a loss |
| 90-day repeat rate | 40% - 60% | 20% - 30% | Low retention forces constant top-of-funnel ad spend |
| Primary growth lever | Contribution margin | Venture capital / Parent company burn | Standard brands cannot compete in pure bid density |
Brands like Cider have attempted to counter this by compressing their design-to-production cycle to seven days, matching the speed of micro-trends on TikTok to drive down their acquisition costs to approximately $28. However, this strategy relies on generating massive organic social traffic, a dependency that carries its own platform risk. If the TikTok algorithm shifts, or if geopolitical tensions result in higher landed costs due to tariff changes, the precarious margins of these fast-fashion entities will evaporate instantly.
Retail media networks and the new trade spend extortion
As customer acquisition costs on social and search platforms erode brand profitability, retailers have identified an opportunity to extract further value from the brands they stock. This has catalyzed the explosive growth of retail media networks (RMNs). By 2026, there are over 200 distinct retail media networks, and they represent the fastest-growing segment of digital advertising, commanding an outsized share of marketing budgets.
Historically, consumer packaged goods companies paid for physical visibility through trade spend. They funded endcap displays, temporary price reductions, and slotting fees to ensure their products were prominent in physical aisles. Retail media digitizes this relationship. Retailers now charge brands for sponsored product placements, search ranking boosts, and display banners across their e-commerce properties and digital applications.
The shift from physical shelves to paid digital placement
The financial mechanics of retail media are extraordinary for the retailer and punitive for the brand. When a retailer sells a standard physical product, they typically operate on a 5% to 10% net margin. When that same retailer sells a digital ad placement on their own website, the margin is frequently 70% to 90%, as the inventory cost is effectively zero.
The scale of this revenue transfer is massive. Walmart’s CFO confirmed that fully one-third of the company's operating profit in a recent quarter was related to advertising and membership income. DoorDash generates approximately 36% of its EBITDA from its advertising platform. Retailers have successfully built a high-margin technology business on top of their low-margin logistics operations.
For brands, this is rarely an incremental growth channel. According to McKinsey’s 2025 analysis, the money brands pour into retail media networks is largely drawn from existing shopper marketing and traditional brand budgets. Retailers are actively integrating trade funds into their monetization engines. If a brand allocates a specific budget for trade spend, the retailer may automatically require half of that budget to be diverted into the retailer’s proprietary advertising network.
Algorithmic rent and the collapse of organic visibility
Brands are effectively paying a toll simply to remain visible on the digital shelf. In the jewelry sector, for example, brands that reduce their Amazon Ads spend observe a 20% to 30% drop in organic visibility within weeks. Non-advertisers are frequently buried on page four of search results, a location visited by less than 1% of shoppers.
This creates a pay-to-play environment. If a consumer asks an AI agent or a retailer search bar for a product category, the algorithm heavily weights sponsored placements. Brands that refuse to pay the retail media tax risk algorithmic invisibility, ceding market share to competitors or to the retailer's own high-margin private-label products. The lack of standardized measurement across these networks compounds the problem; fewer than 10% of RMNs comply with industry standards like the Media Rating Council, allowing retailers to operate as closed ecosystems where they dictate both the cost of entry and the reporting of success.
The distortion of email marketing returns
When acquisition costs rise and retail networks demand a larger share of the margin, marketing teams naturally attempt to highlight the efficiency of their owned channels to balance the blended performance of the department. This dynamic regularly produces the most distorted metric in digital marketing: the reported return on investment for email.
Industry reports, such as the Litmus State of Email analysis, routinely claim that email marketing delivers a 3600% ROI, generating $36 for every $1 spent. Specific software vendors operating in the e-commerce sector claim their users see returns as high as $72 for every dollar spent. These figures are heavily utilized in software procurement pitches and marketing board presentations to justify software investments.
The problem is not that the metric is mathematically false based on the dashboard inputs. The problem is that it answers the wrong question and fundamentally misunderstands consumer intent.
Separating retention value from net new demand
Email marketing platforms utilize last-touch attribution. If a consumer receives an email, clicks a link, and completes a purchase, the email platform claims 100% of the revenue value of that transaction. This model completely ignores the sequence of events, and the associated capital expenditure, that led the consumer to join the email list in the first place.
Consider the mechanics of an abandoned cart email workflow. A consumer clicks a Meta ad, browses a product, adds it to their cart, inputs their email address, but fails to check out. Four hours later, an automated email offers a 10% discount. The user clicks and buys. The email platform reports a massive return on investment, capturing the full revenue of the cart against the microscopic cost of sending one automated message.
However, the email did not create the demand. The initial paid media expenditure created the demand, the brand equity supported it, and the product design validated it. The email merely harvested the existing intent at the final stage of the journey. Blending these bottom-of-funnel retention metrics into a broad channel ROI calculation creates a false equivalency between acquiring a new customer and reminding an existing customer to finish a transaction. A brand cannot scale its business infinitely by simply sending more emails to the same database. The 3600% figure represents the efficiency of retention communication, not the cost of generating enterprise growth.
Subscription economics and the Spotify retention machine
If retail media illustrates how platforms extract margin from brands, Spotify illustrates how massive consumer data can be weaponized to extract margin from users. By the fourth quarter of 2025, Spotify reached a record 751 million monthly active users globally. A significant portion of its engagement strategy relies on its annual Wrapped campaign.
In 2025, Spotify Wrapped reached 200 million engaged users within 24 hours, representing a 19% year-over-year increase. Users shared their personalized data summaries over 500 million times across social networks. The campaign is universally praised as a masterclass in organic marketing, generating billions of impressions without direct media spend.
However, looking at Wrapped merely as a viral acquisition tool misreads its primary commercial function. It is a highly engineered retention mechanism designed to mitigate subscriber churn during a period of structural price inflation.
Measuring behavioral utility instead of reported reach
The underlying economics of music streaming are tightening. In 2026, Spotify and other streaming platforms operate under new "streaming 2.0" agreements with record labels that effectively increase royalty costs by 5% to 6%. Spotify has actively passed these costs onto the consumer, implementing price increases across 150 countries in 2025 and executing further hikes in the US market in early 2026, which is expected to generate an additional $1 billion in revenue.
Standard behavioral economics dictates that price increases typically trigger subscriber churn. Spotify uses Wrapped to counteract this impulse. By packaging a user’s behavioral data, Spotify transitions its product from a mere utility into an archive of personal identity. The social sharing aspect functions as a status signal. The user is not just paying for access to music; they are paying for the right to participate in an annual cultural moment that validates their taste and secures their place in a micro-community.
This strategy works. Despite raising prices and briefly becoming the most expensive streaming option, management notes that the price hikes have had no material impact on subscriber churn.
Yet, there is a growing friction between the polished data narrative Spotify presents and the reality of algorithmic delivery. A vocal segment of users increasingly questions the accuracy of their Wrapped data, noticing discrepancies between their actual listening habits and the platform's reporting. Users complain about the arbitrary mid-November data cutoff and instances where algorithmic autoplay inflates the rankings of specific artists. The data is not a neutral reflection of reality; it is a curated output influenced by the platform's own recommendation engine. Still, the commercial objective is met. The data may be skewed, but the user pays the increased monthly fee regardless.
Vanity metrics versus the Nike financial reality
The divergence between reported marketing activity and commercial performance is most visible when analyzing large consumer brands that rely heavily on cultural relevance. Nike’s operations in 2025 and 2026 provide a clinical case study in the limitations of brand marketing metrics when decoupled from operational health.
During this period, Nike's marketing campaigns continued to generate staggering top-of-funnel visibility. The "You Can't Stop Us" campaign achieved over 58 million views. Analytics firms reported that the campaign generated $8.95 million in media impact value from a small number of placements, highlighting the massive earned media power of their athlete endorsements. The brand consistently tops cultural relevance charts and social media engagement indices.
The financial filings tell a decidedly different story.
The danger of confusing visibility with demand
In its fiscal 2026 third-quarter results ending February 28, 2026, Nike reported $11.3 billion in revenue, which was entirely flat on a reported basis and down 3% on a currency-neutral basis compared to the previous year. The company's net income dropped by a staggering 35% to $0.5 billion. Gross margin decreased by 130 basis points to 40.2%, heavily impacted by North American tariffs and the rising cost of product inventory.
While the brand accumulated millions of views, its Converse division saw revenues decline by 35%. The direct-to-consumer business, which was supposed to be the engine of modern margin expansion, fell by 4%. The company has been forced to aggressively discount older inventory while losing market share in the performance running category to emerging competitors like Hoka and On, who have capitalized on hyper-local running club communities rather than massive television broadcasts.
Agencies celebrate billions in automated ad spend while the average user installs three ad blockers and scrolls past sponsored content with trained indifference. Are we optimizing for persuasion, or just for reportable activity?
Nike’s situation demonstrates that mental availability and media impact value do not automatically translate into pricing power or sales velocity. A brand can command the attention of millions on social media, but if the product mix is misaligned, if tone-deaf messaging alienates core demographics, or if competitors build superior local community engagement, the top-line revenue will stall. Marketing dashboards measure interactions; the balance sheet measures transactions. When brands optimize for the former at the expense of the latter, they end up with culturally resonant campaigns that fail to arrest margin decline.
| Metric type | Nike reported performance | Commercial implication |
| Vanity metric | 58 million campaign views | Broad cultural visibility achieved, largely detached from immediate sales |
| Vanity metric | $8.95M media impact value | High efficiency in earned media amplification, but no guaranteed payback period |
| Financial metric | Flat total revenue ($11.3B) | Massive cultural visibility failed to drive net-new aggregate growth |
| Financial metric | 35% net income decline | Structural costs, tariffs, and discounting erased bottom-line profitability |
To stabilize the business, Nike's leadership implemented a "Win Now" turnaround strategy, demanding a realignment of teams and a rebalancing of the portfolio away from a pure direct-to-consumer focus back toward wholesale partnerships with retailers like Foot Locker and JD Sports. The realization is clear: capturing digital engagement is irrelevant if the brand is not physically present where the consumer actually prefers to transact.
Zero-click search and the collapse of B2B inbound
Outside of walled environments like Spotify and Meta, the open web is undergoing a structural collapse in traditional traffic routing. For nearly two decades, the inbound marketing model relied on a clear transaction: businesses published educational content, search engines indexed it, and users clicked through to the website, entering the marketing funnel.
By 2026, that transaction has been unilaterally altered by search providers. The integration of generative artificial intelligence into search results has transformed search engines into answer engines. Instead of providing a list of links, systems like Google AI Overviews read the content, synthesize it, and deliver the answer directly on the results page.
The behavioral shift is stark. Current data indicates that approximately 60% of all searches now end without a single click to an external website. When an AI summary appears, only 8% of users bother to click through to a traditional organic link.
The changing value of surviving traffic
This zero-click environment is devastating for business-to-business marketing models built on top-of-funnel traffic volume. Some sectors are observing 70% to 80% drops in organic discovery traffic. If a company's primary acquisition strategy relies on users visiting a blog post to read a definition and subsequently downloading a whitepaper, that pipeline is effectively broken.
However, the collapse in volume obscures a fundamental shift in traffic quality. The users who do choose to click past an AI summary possess significantly higher intent. Because the AI has already answered their basic informational queries, the users who proceed to a brand's website are usually looking for specific vendor capabilities, original data, or direct commercial engagement.
Consequently, the average visitor originating from an AI-assisted search is currently worth 4.4 times more in pipeline value than a traditional organic visitor. The traffic volume has plummeted, but the conversion rate of the surviving traffic has escalated. Marketers must adjust their tracking expectations accordingly. Reporting on raw organic sessions is no longer a viable indicator of business health. Brands must shift to Generative Engine Optimization (GEO), structuring content explicitly to be cited by large language models, ensuring mental availability even when a click does not occur.
Agency theater and the shift to agentic media
The automation of media buying and the shift in search behavior has forced advertising agencies into an existential crisis. The traditional agency model relies on billing hourly rates for manual campaign adjustments, keyword bid management, and reporting compilation. As platforms enforce autonomous buying systems like Performance Max and Advantage+, the manual labor required to operate a campaign diminishes.
To maintain their margins, agencies have rapidly adopted the language of agentic media. They pitch systems that purportedly use AI agents to autonomously reallocate budgets, suppress audiences, and swap creative mid-flight based on real-time signals.
This rapid consensus often masks a severe lack of technical depth. In many cases, what is sold as an advanced agentic system is merely a large language model wrapped around a standard programmatic workflow. Furthermore, delegating strategy entirely to AI introduces massive operational risks. When the payment services provider Klarna scaled up its AI-powered customer services, it initially reported major efficiency gains. However, months later, the company admitted that it had over-automated, damaging the customer experience and forcing a reintroduction of human workers.
The necessity of data governance over execution
The actual value an agency provides in 2026 has nothing to do with deploying AI wrappers. The value lies in establishing the foundational data infrastructure that allows automation to function correctly.
If an autonomous system is granted the authority to shift media budgets, the underlying data must be flawless. If the agentic system is fed incomplete identity data, flawed last-click attribution models, or delayed CRM imports, it simply optimizes faster in the wrong direction.
Stanford research evaluating enterprise AI deployments in 2026 found that in 42% of cases, the actual AI model was entirely interchangeable. The barriers to success were not technical; 77% of the challenges were related to change management, data quality, and process redesign.
Agencies that survive the current cycle are moving away from execution and toward infrastructure. They audit analytics setups, implement server-side tagging, design consent architectures, and build models to measure true incrementality. The output is no longer a monthly slide deck showing automated click-through rates. The output is a secure pipeline of first-party data that allows a brand to trust the autonomous decisions made by the ad platforms.
Reconciling marketing reports with commercial outcomes
The digital marketing industry in 2026 is defined by the tension between platform automation and commercial accountability. The tools available to marketers have never been more powerful, yet the metrics used to judge success have rarely been less reliable.
Ad platforms rely on modeled conversions to mask the reality of attribution decay. Marketplaces artificially inflate acquisition costs through subsidized, unprofitable spending. Retailers compress brand margins by demanding physical trade spend be diverted into proprietary digital media networks. Email platforms claim exorbitant returns by taking credit for existing demand.
Navigating this environment requires executives to firmly reject vanity metrics and platform propaganda. A high ROAS reported inside Meta is completely meaningless if the payback period exceeds the cash flow capabilities of the business. A massive spike in brand visibility is commercially useless if high return rates, supply chain tariffs, and deep discounting erase the gross margin, as demonstrated by the recent struggles in the sportswear sector.
The marketers who succeed in this environment operate with extreme skepticism. They do not trust the platforms to grade their own homework. They build resilient first-party data pipelines, they enforce incrementality testing to prove causality rather than mere correlation, and they understand that their ultimate job is not to generate reportable digital activity, but to drive profitable, measurable commercial demand.


