

Post-earnings close read · Stock analysis
Four numbers decide whether Marvell's acceleration improves earnings quality
The Q3 guide is not only a demand signal. It is a test of how fast operating dollars can grow while the business becomes more concentrated in Data Center.
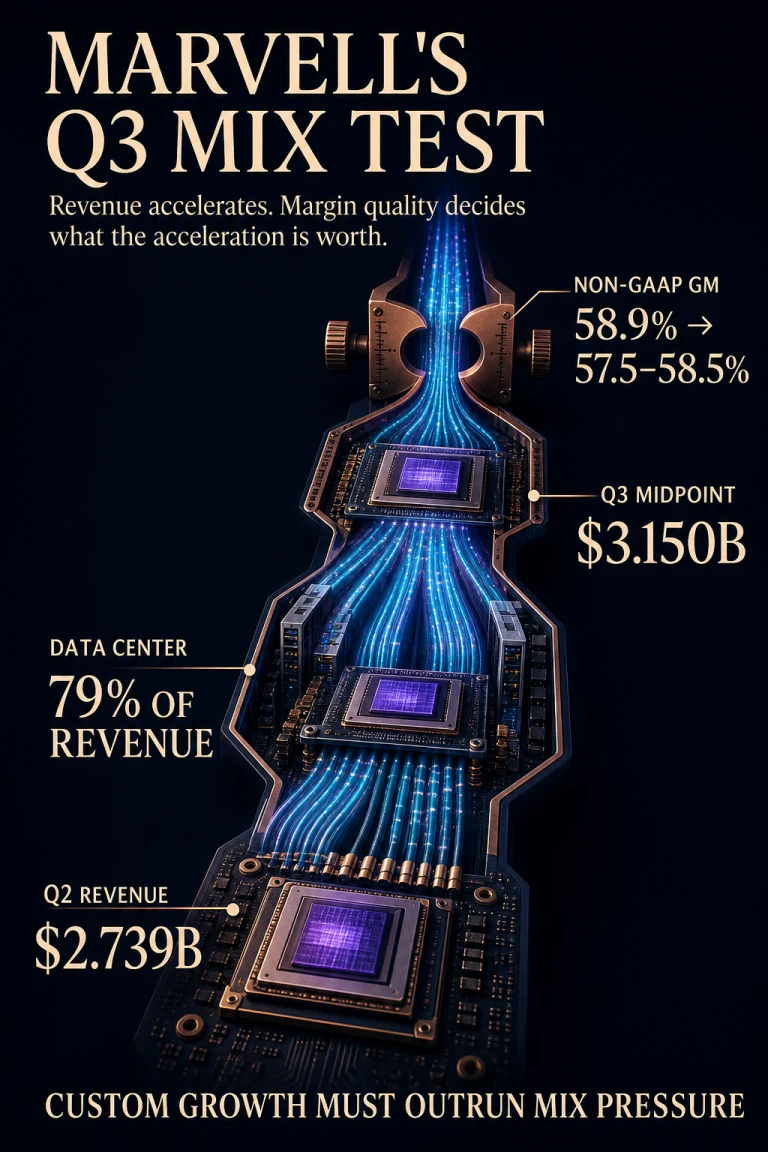
- Data Center now supplies 79% of revenueThe segment grew 18% sequentially in Q2 while Communications and other declined 3%, so almost all near-term acceleration depends on one end market.
- The Q3 midpoint asks for another 15% sequential stepRevenue guidance of $3.150 billion is $410.7 million above Q2, with management pointing to a significant Custom acceleration in the second half.
- The gross-margin midpoint falls by 0.9 percentage pointsNon-GAAP gross margin moves from 58.9% in Q2 to a 58.0% midpoint for Q3. That is mix pressure, not automatically an earnings failure.
- Operating-profit dollars are the reconciliationAt the guide midpoints, implied non-GAAP operating income still rises roughly 17% sequentially if revenue, margin and operating expense all land as guided.
Marvell's record second quarter is easy to summarize and easy to misread. Revenue reached $2.739 billion, up 37% year over year, and management guided the third quarter to $3.150 billion at the midpoint. The press release also says the Custom business should accelerate significantly in the second half of fiscal 2027.
The harder question is not whether AI infrastructure demand is strong. It is whether Marvell can convert a more custom, more concentrated revenue mix into operating profit at least as quickly as it converts bookings into sales. The company's own guide supplies a clean test because revenue accelerates while the midpoint of non-GAAP gross margin moves lower.
The growth engine has become more concentrated
Data Center revenue was $2.1715 billion in Q2, up 46% year over year and 18% sequentially. It represented 79% of company revenue, compared with 76% in Q1 and 74% one year earlier. Communications and other produced $567.8 million and declined 3% from Q1.
This creates a useful asymmetry. Marvell is not merely growing faster; its fastest-growing end market is becoming a larger share of the denominator. The Q3 midpoint is about 15% above Q2 revenue, so the next step cannot be explained by a broad recovery across both reported end markets. It depends primarily on Data Center connectivity and the expected acceleration of Custom silicon.
End-market concentration
Data Center gained five points of company mix in one year
Q2 FY26
74%
Q1 FY27
76%
Q2 FY27
79%
$2.1715B
The mix shift is reported. The amount contributed by Custom versus Connectivity is not.
Custom silicon changes the margin question
A merchant chip vendor sells a broadly reusable product. A custom silicon program is designed with a particular hyperscale customer, workload and system roadmap in mind. That can create large, durable programs, but the revenue economics can differ from merchant products because development responsibilities, customer concentration, volume commitments and the share of system value captured by the supplier are different.
Marvell does not disclose quarterly revenue or gross margin separately for Custom and Connectivity. It would therefore be an unsupported leap to say that the lower Q3 gross-margin guide is caused by Custom. Management's wording supports a narrower conclusion: Custom is expected to accelerate during the same period in which company revenue accelerates and the non-GAAP gross-margin midpoint declines.
A lower margin rate can still produce faster profit growth
The useful reconciliation is in dollars. Q2 non-GAAP gross margin was 58.9%, which implies approximately $1.613 billion of non-GAAP gross profit on $2.7393 billion of revenue. At the Q3 revenue midpoint of $3.150 billion and the 58.0% midpoint of the gross-margin range, implied non-GAAP gross profit is approximately $1.827 billion.
That is about 13% sequential growth in gross-profit dollars despite a 0.9-point decline in the margin rate. Subtract the guided $655 million of non-GAAP operating expense and the midpoint implies roughly $1.172 billion of non-GAAP operating income, around 17% above Q2's reported $1.003 billion. The result is close to the 17% sequential increase implied by non-GAAP EPS guidance of $1.10 versus $0.94.
Midpoint reconciliation
The margin rate narrows while operating dollars can still widen
Q3 revenue midpoint
$3.150B
× 58.0%
Implied non-GAAP gross profit
$1.827B
− $655M
Implied non-GAAP operating income
$1.172B
Derived midpoint calculation, not company guidance for operating income. Rounding may affect totals.
The reported mix cannot identify the winning product line
The Data Center category includes custom XPUs and XPU-attach products, Ethernet switching, optical connectivity, storage and other infrastructure. A 79% end-market share does not tell investors how much revenue came from any one product family. Nor does a company-level margin guide identify the gross margin of a custom program.
This is the central evidence boundary. The Q3 print can show that aggregate economics are improving, but it cannot by itself prove that Custom is the highest-margin growth engine, that Connectivity is losing share or that acquisitions are responsible for the change. Those claims require product-level disclosure that Marvell has not provided in the release.
Evidence boundary
What the Q2 release proves — and what remains unallocated
| Disclosure | Known | Not proven |
|---|---|---|
| Data Center revenue | $2.1715B; 79% of Q2 revenue | Custom revenue as a separate dollar amount |
| Q3 revenue guide | $3.150B ±5% | Which product family supplies each incremental dollar |
| Q3 non-GAAP GM | 57.5%–58.5% | Gross margin of Custom or Connectivity alone |
| Management outlook | Significant Custom acceleration expected in 2H FY27 | A quarterly Custom run rate or customer concentration |
Three outcomes would mean three different things
The Q3 result should be classified by the relationship between revenue, gross-margin rate and operating-profit dollars. A single headline beat cannot resolve all three.
Quality acceleration
Revenue lands above the midpoint, gross margin holds inside or above the range, and operating-profit dollars outgrow revenue. Custom and Connectivity are scaling without visible company-level dilution.
Planned mix shift
Revenue and operating income meet the guide while gross margin settles near 58%. The lower rate is economically absorbed by volume, but product-level attribution remains unresolved.
Mix pressure wins
Revenue reaches the guide but gross margin and operating income fall below their implied paths. The growth remains real, yet its incremental economics deserve a lower-quality classification.
Investor Day should allocate the growth, not repeat the total
Marvell has scheduled Investor Day for 6 October 2026. The useful disclosure would not be another restatement that AI bookings are strong. Investors need a clearer allocation of Custom and Connectivity growth, the timing of design-to-production ramps, the operating-expense intensity required to support those programs and the conditions under which gross margin can stabilize.
This distinguishes the analysis from the NVIDIA China-option framework, which separates a geographic export channel from the core guide, and from the TSMC 2 nm ramp, which follows the economics of a manufacturing node. It also differs from the AMD load test: Marvell has already disclosed that Data Center carries the company. The open question is how the mix inside that segment converts to profit.
This article is independent editorial analysis, not a recommendation to buy or sell securities. Derived figures use the midpoint of management guidance and are not company-issued forecasts of gross profit or operating income.
Questions investors may still have
How much of Marvell's Q2 revenue came from Custom silicon?
Marvell did not disclose a separate quarterly Custom revenue figure. It reported $2.1715 billion of Data Center revenue and said Custom should accelerate significantly in the second half.
Does the lower Q3 gross-margin midpoint mean profit will decline?
Not at the guide midpoint. Revenue growth is large enough that implied non-GAAP gross-profit and operating-income dollars still increase. The calculation depends on revenue, margin and operating expense all landing near their midpoints.
Why focus on operating income instead of EPS alone?
Operating income reconciles revenue, gross margin and operating expense before interest, taxes and share-count effects. EPS remains useful, but it answers a broader question than product-mix conversion.
What would make the thesis fail?
The thesis would weaken if product-level disclosure showed that Custom is not a material contributor to the second-half acceleration, or if company-level gross-margin changes were clearly driven by an unrelated temporary item.
Primary financial sources
Marvell materials checked 28 August 2026
- Marvell Q2 FY2027 financial-results release, 27 August 2026.
- Marvell Q2 FY2027 investor-relations results hub, including financial and additional earnings materials.
- Marvell Q1 FY2027 release filed with the SEC, 27 May 2026.
- Marvell AI memory infrastructure portfolio release, 4 August 2026.


