

Apple FY2025 · Stock analysis
A buyback total is only one side of the share count
Follow the share movement before assigning an earnings benefit to it.
- Net issuance offsets part of the repurchaseApple’s FY2025 share reduction was smaller than the number bought back. The exact reconciliation is below.
- A closing balance cannot reproduce annual EPSEarnings per share uses a weighted-average denominator, with an additional adjustment for dilution.
- Fewer shares do not settle the value questionThe purchase price, financing and use of company cash still matter. Share arithmetic alone cannot establish a good investment.
A company announces billions of dollars in buybacks. The natural next question is how much more of the business each remaining share now represents. Dividing the spending by market capitalization is a tempting shortcut, but it skips the actual movement in shares.
Apple’s fiscal year ended 27 September 2025 provides a complete historical case. This is a reading of that annual filing, not an update on its latest quarter or a valuation of today’s stock. The exercise has two parts: reconcile the closing share count, then test whether that closing count belongs in the earnings calculation.
Start with the four lines that reconcile
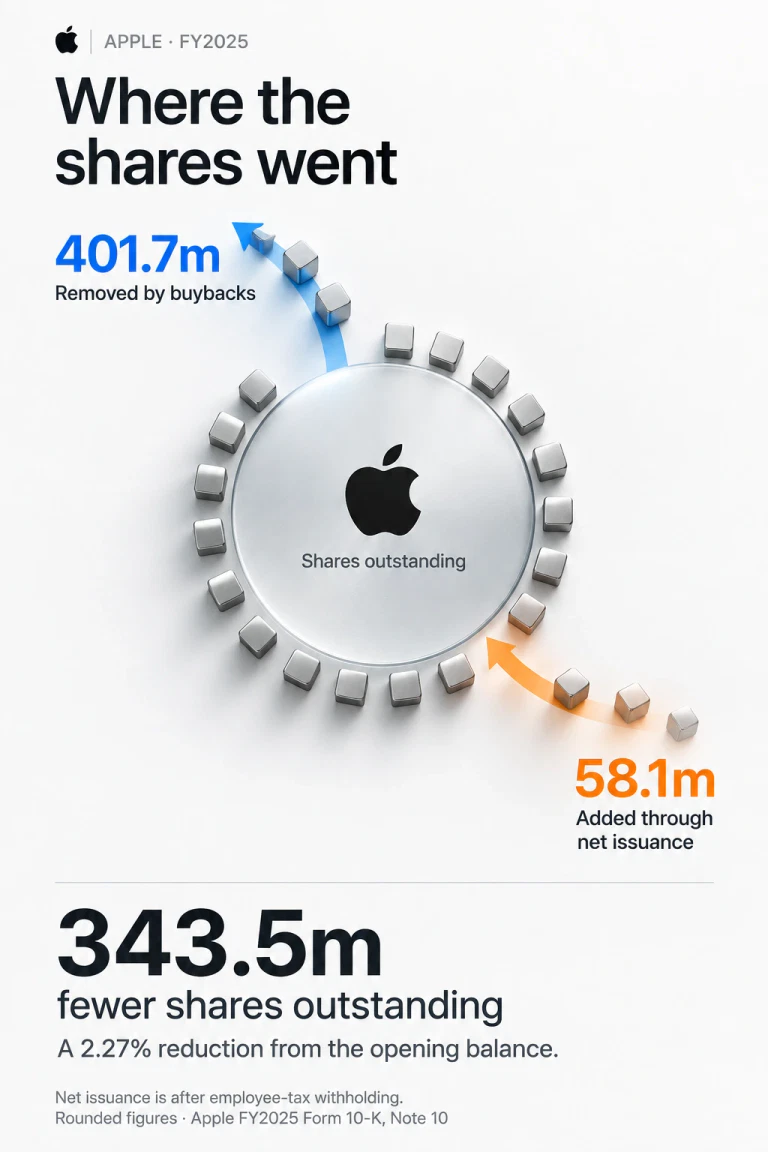
In Note 10 of Apple’s FY2025 Form 10-K, the repurchase narrative rounds the total to 402 million shares and $89.3 billion. The share table gives the more precise movement. Its original unit is thousands; the table below converts every share figure to millions.
FY2025 · millions of shares
Opening balance minus buybacks plus issuance
| Share movement | Millions |
|---|---|
| Opening shares | 15,116.786 |
| Less repurchased | −401.672 |
| Plus net issuance | +58.146 |
| Closing shares | 14,773.260 |
Our calculation gives a net reduction of 343.526 million shares: 401.672 minus 58.146. Relative to the opening balance, that is 2.27%. Net issuance offset about 14.5% of the repurchased share count. These are share-unit calculations, not percentages of the dollars spent.
Keep grants, issued shares and compensation expense apart
The important word in the issuance row is “net.” Adding a separate estimate of tax-withheld shares back into this reconciliation would change its definition. Subtracting them again would count the adjustment twice. Use the row as reported when reconciling the opening and closing balances.
A compensation grant is also different from an issued share. Think of a hypothetical employee award that vests over several years. The grant can exist before the employee receives the underlying shares. A table of new awards therefore cannot simply replace a table of shares issued during the year.
The same unit discipline applies to compensation expense. Dollars of expense and millions of shares are different quantities. Turning one into the other requires assumptions about price, measurement and timing. That extra model is unnecessary when the filing already supplies the share movement you need.
The closing share count gives the wrong annual EPS
Apple’s FY2025 financial statements report annual net income of $112,010 million and 15,004.697 million diluted weighted-average shares. Dividing those two figures produces about $7.465, which rounds to the reported $7.46 diluted EPS.
Now deliberately use the wrong denominator. Divide the same profit by the 14,773.260 million closing shares. The answer is about $7.58. Nothing happened to profit between those two calculations. The second answer is higher because it applies an end-of-year snapshot to earnings accumulated over the whole year.
A hypothetical company illustrates the timing problem. Suppose it has 100 shares for almost the entire year and repurchases 10 on the final day. Dividing the entire year’s profit by 90 would treat those shares as absent long before they were bought back. Buying the same 10 shares at the beginning of the year has a different weighted-average effect even if the closing balance is identical.
Dilution is a second distinction. Apple’s Note 3 adds 56.197 million shares from dilutive awards to 14,948.500 million weighted-average basic shares. That produces the diluted denominator above. The annual average and the dilution adjustment must both be preserved; neither is a synonym for closing outstanding shares.
Consequently, the 2.27% closing share reduction is not a measured 2.27% EPS uplift. Isolating what EPS would have been without buybacks would require a counterfactual for the timing of repurchases and, for a full economic analysis, the consequences of retaining or financing the cash. The closing-balance table cannot supply that counterfactual by itself.
A larger ownership fraction is not a stock return
Investor.gov describes a share as ownership in a company. Holding the same number of shares while the company’s outstanding total falls increases that ownership fraction. But the fraction and the value of the company are separate variables.
Consider a deliberately simple example: a business has $1,000 of value, including cash, split across 100 shares. If it spends $100 buying 10 shares at $10, it has $900 left across 90 shares, still $10 per share in this stripped-down model. The percentage owned by someone who keeps one share increases, yet no extra value has been created merely by changing the count. Real capital-allocation decisions require more than this illustration, especially a view on what the shares are worth.
That is why cash conversion and the timing of buybacks deserve a separate analysis. The share reconciliation establishes what happened to ownership units. It cannot establish whether management paid too much or sacrificed a better use of funds.
Read the next buyback headline in this order
- Fix the period and unit. Keep fiscal-year shares, dollars and quarterly figures in separate columns.
- Reconcile the shares. Start with opening outstanding shares, subtract repurchases and include the reported issuance movements. Confirm the closing balance.
- Choose the denominator for the question. Closing shares describe ownership at a date. Weighted-average diluted shares belong in annual diluted EPS.
- Only then judge allocation. Investigate price, cash needs and financing before assigning economic value to a lower share count.
The broader reading habit is to preserve the exact quantity attached to a headline. An acquisition calendar can change a revenue-growth denominator; a customer cohort can be mistaken for a product revenue line. Here the error is to treat a gross transaction count, a closing balance and a weighted average as interchangeable.
Questions about Apple’s share reconciliation
Does the issuance offset mean most of the buyback was cancelled out?
No. Our calculation leaves about 85.5% of the repurchased share count as a net reduction. That is a share-count comparison, not a measure of money wasted or value created.
Can the remaining buyback authorization predict the next share reduction?
No. An authorization is permission, not a completed transaction. Future prices, actual execution and issuance all affect the resulting share count.
Filing references and calculation basis
Primary sources checked 12 September 2026
- Apple FY2025 Form 10-K — Note 10 share roll-forward and authorization; Note 3 EPS denominator.
- Apple FY2025 consolidated financial statements — annual profit, share denominator and EPS; use the twelve-month column.
- Investor.gov Stocks — ownership and investment risk.
Calculations use unrounded filing inputs. Infographic share figures round to one decimal; the table preserves three. Hypothetical examples explain arithmetic and are not reported Apple transactions.


